🚀 Introducing Contentpen – Your AI-Powered content assistant!Join the waitlist.
LinkedIn analytics: Tracking your LinkedIn performance
Unlike your average social media channel, LinkedIn is focused on creating work-related connections. From service providers to companies like Amazon, LinkedIn is where individuals and businesses alike can build their network, recruit employees, find clients, or even research other brands or job-seekers.
The key to growing on LinkedIn though? Keep a keen eye on your LinkedIn Analytics as it shows you details like your profile engagement, post impressions, and much more.
The question now is: how can you track your analytics, and which metrics should you focus on? We’ll answer this and much more in this guide on LinkedIn analytics.
Here’s an overview of what you’ll learn today:
- Is LinkedIn marketing still relevant in 2025?
- What is LinkedIn Analytics?
- Why track LinkedIn analytics?
- How to access LinkedIn Analytics?
- 6 LinkedIn Analytics metrics you should focus on
- What’s the difference between LinkedIn in-app Analytics and LinkedIn analytics tools?
- Top 7 LinkedIn analytics tools
- Using LinkedIn analytics for shaping an effective marketing strategy
Is LinkedIn marketing still relevant in 2025?
Since its inception in 2003, LinkedIn has proved to be an irreplaceable social space. By the end of 2024, LinkedIn has acquired over 1 billion users across 200 countries and territories. This proves that LinkedIn marketing is still relevant in 2025.
With a solid LinkedIn marketing strategy, companies can achieve many business goals. For instance, with a LinkedIn page your company can establish credibility, hire talent, build purposeful partnerships as well as create brand awareness.
 The best part is that LinkedIn doesn’t just enable you to upload your resume. Instead, it gives you a chance to create long posts, publish blogs, run a newsletter, and share images that help you to educate others, share your accomplishments or behind-the-scenes content all while building your brand repertoire.
LinkedIn Marketing
Establish your brand’s profile on LinkedIn by consistently posting engaging content and engaging with the community.
Get Started for FREE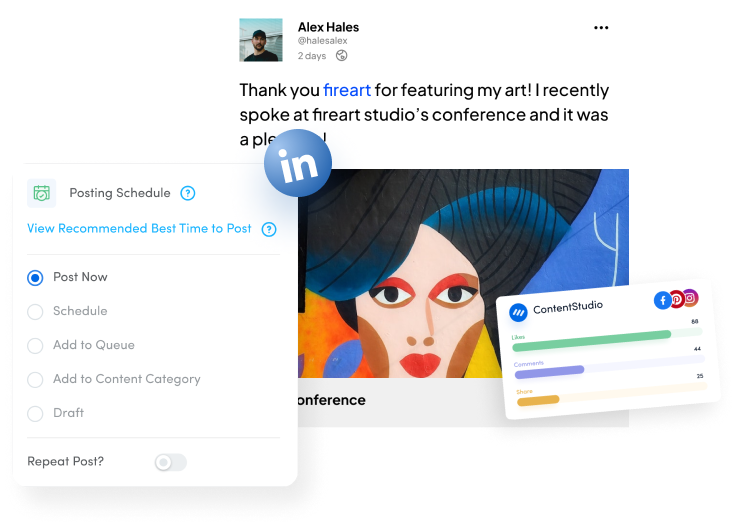
What are LinkedIn analytics?
LinkedIn Analytics refers to the in-app data available on the performance of your posts, profile/page, and updates. LinkedIn data analytics are available for all company pages as well as personal profiles. However, there’s a difference between the analytics available to both.
For company pages, LinkedIn Analytics reveals the following data types:
- Content: learn about the views, impressions, likes, comments and shares that your posts and updates receive.
- Followers: This section tells you where your followers are coming from and shows follower demographics.
- Visitors: here, you find the non-followers who have viewed your profile, where they’re coming from, and their demographics.
- Leads: Through this section, you will find information on the users who have filled out your page’s lead generation form in the last 90 days.
- Competitors: here, you can compare your company page’s followers and engagement with that of competitors.
- Employee advocacy: if you have employees mentioned on LinkedIn, this area will let you know how they’re interacting with recommended content.
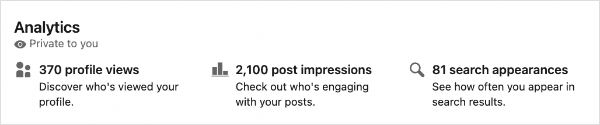
As for LinkedIn profile analytics, you’ll find the following information:
- Profile views: this is the number of people who have viewed your profile in the last 90 days. If you have a premium account, you can view the names of your viewers as well.
- Post views: here you find data on the views your posts have received on the whole.
- Search appearances: this section covers data on your weekly search appearances. It also reveals information on where your searchers work, what they do, and the keywords they’re using.
Now whether you have a company page on the application or you’re looking at your LinkedIn profile analytics, you can find analytics for individual posts as well. These detail you in on the engagement and impressions of each post on your profile.
Why track LinkedIn analytics?
Several people on LinkedIn just set up a profile with a catchy bio highlighting their star moments. In reality though, this is not enough.
Your profile or LinkedIn page can open up opportunities, encourage connections with the right people, and reach business goals only if you share content that resonates with your target audience there.
But wait — is there such a thing as a ready-to-go content plan for LinkedIn? Not really. A successful strategy requires you to track your LinkedIn analytics to drive fruitful results from your efforts.
Tracking LinkedIn analytics helps:
- Gather followers, visitors or viewers demographics to learn about their traffic sources, job titles, company size, and more.
- Gauge if you are targeting the right audience and see if your content is resonating with your audience.
- Compare your performance on LinkedIn to that of competitors as well as set realistic benchmarks.
- Create content that educates your audiences and encourages conversions and sales.
- Reveal the effectiveness of your organic as well as paid posts on the app.
How to access LinkedIn analytics?
Now that you know what analytics you can find within the app and why you need them, let’s also quickly touch on how you can access your in-app Analytics.
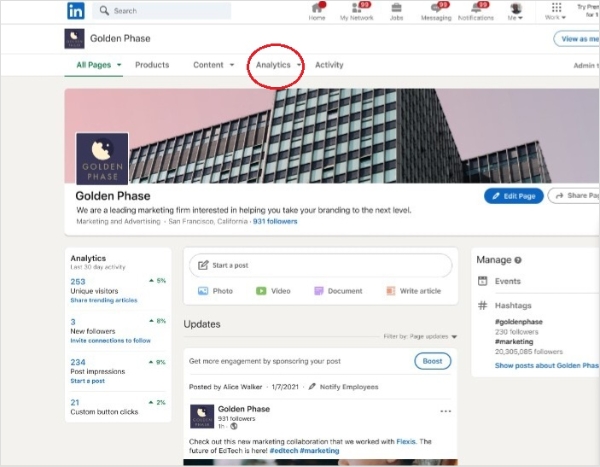
Company pages on LinkedIn can find Analytics on their dashboard. The top menu bar has an Analytics tab. Clicking on it reveals a dropdown menu with analytics types.
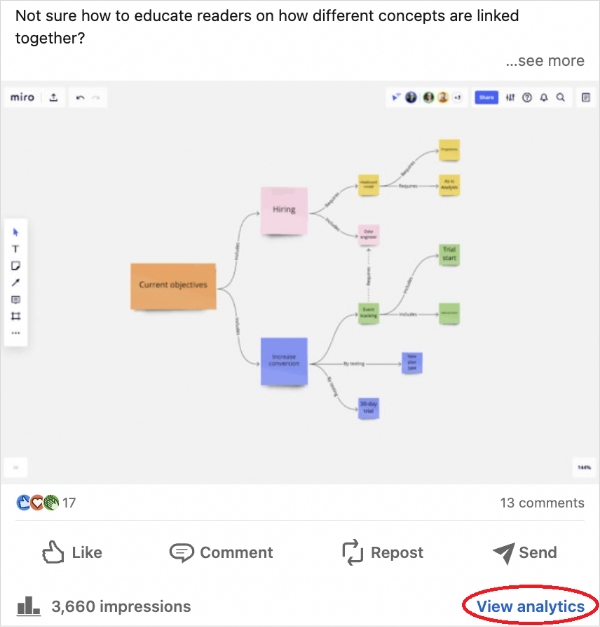
You can find post analytics right at the bottom of each post. You’ll also spot a graph with the number of impressions beneath your posts. Tap on View Analytics at the right side of the graph.
As for Profile Analytics, those are visible right under the dashboard on the Profile page.
Also Read: How to use hashtags on LinkedIn?
6 LinkedIn analytics metrics you should focus on
To reiterate, measuring the right KPIs helps you stay on top of your marketing game as you learn where you’re acing and what you need to tweak in your marketing strategy.
But with so many LinkedIn insights available, you might lose sight on exactly which metrics you must consistently track.
So, below are 6 LinkedIn Analytics metrics that you should pay attention to if you’re striving to achieve your business goals:
- Engagement
The first and most important metric to measure on social media is engagement. Engagement refers to how your audience is interacting with the content you’re posting. It covers the likes, comments, and shares that your posts receive.
If you’re regularly posting content but it’s not getting enough engagement, you need to change your content strategy. This is because poor engagement indicates that your audience is not interested in your posts.
Another reason for a low engagement rate can be inconsistent posting. For increasing your posting frequency and consequently your profile engagement, you can use a social media post scheduler that automates posting for you. ContentStudio is one such tool that helps you queue your LinkedIn posts for publishing at a later time.
On the contrary, a high engagement rate is a strong indicator that your content is resonating with your target audience.
- Reach
By tracking your account’s reach you can learn if your posts are showing to enough people.
You see, sometimes your content is worthy of engagement but it has a low reach. Meaning: not many people are able to see your updates.
When this happens you must change your content strategy such that you’re able to reach wider audiences on LinkedIn to increase brand awareness. One way to do so is by focusing on posting more paid content such as ads rather than solely relying on organic postings.
- Impressions
Impressions are the views your content gets. The impressions metric on LinkedIn covers unique views as well as multiple views from the same person.
And why is this KPI important? Because it lets you know if your audience finds your content worth viewing. It tells you if new LinkedIn users have viewed your posts and which posts are receiving views from the same people.
This way, you know which people have a high chance of converting and if your content is getting unique viewers regularly.
You can find impressions for individual posts mentioned right at the bottom. You can also use a third-party tool to get more detailed insights on your content viewers to create a more on-point content marketing strategy.
- Clicks and click-through rate
Yet another must-monitor KPI is your page’s CTR or click-through rate. This rate hints at the average number of people who stopped to click on links shared in your posts. It’s a great indicator of the effectiveness of your call-to-actions as well as shows how interested people are in your company.
If one post has a low CTR while another has a high click-through rate, assess what you did right with the post which has received more clicks. You can replicate the formula or create similar posts that get people to click to visit the site to purchase from you, book a trial or just learn more about your brand or service.
Clicks, however, are different from click-through rate. On LinkedIn, they refer to the number of people who click on the link given in your profile. This link mostly leads to the website of the company or profile.
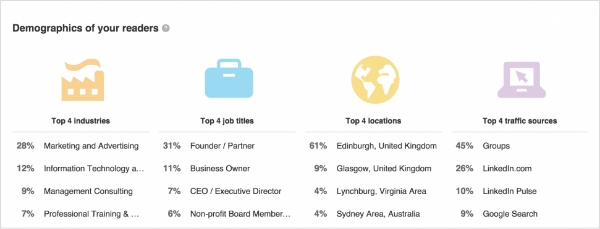
- Audience demographics
You can use in-built LinkedIn Analytics or a third-party tool such as ContentStudio Analytics to get deeper insights on the audience you’re targeting.
With the analytics available natively in the app, you can easily fetch information such as the location and job title of your followers and visitors. This information is crucial to see if you’re successfully targeting people in your target location and niche.
In case your posts are attracting the wrong audience, it’s time you make major changes to your LinkedIn content plan.
- Visitors
Finally, keep a check on your page or profile visitors. These are people who are viewing your profile and your activity but they’re not following you… yet.
By tracking this metric, you can learn who your visitors are and if they fall in your target audience. Your aim should be to convert your visitors into followers or even buyers.
Then, plan on how you can convert them into loyal followers to increase engagement on your LinkedIn page or profile.
For this, create content that pushes them to interact with you. Example: create informative content written in a friendly yet authoritative tone (or whatever aligns with your brand voice) and add a question at the end to encourage engagement.
Read-up: How to beat LinkedIn algorithm?
What’s the difference between LinkedIn in-app analytics and LinkedIn analytics tools?
Where LinkedIn’s native Analytics gives you basic metrics, a third-party analytics tool gives you detailed insights on your content and profile’s performance, better reporting, automation, and more functionalities.
In fact, external LinkedIn analytics tools connected to your LinkedIn dashboard also support teamwork and connectivity with other social media channels your brand uses.
To put it briefly, a valuable third-party LinkedIn analytics tool comes with some of the following perks:
- Real-time insights to enable you to make better decisions regarding your content plan on LinkedIn.
- A single dashboard for monitoring and comparing data across various social accounts of a company.
- Detailed metrics, such as your page’s conversion rate and trends in engagement, followers, and other KPIs can be merged into an easily digestible report.
- A team collaboration dashboard where different members of your team, such as social media managers, content marketers, and content creators, can collaborate.
- Automated email reporting so that you can receive data on important metrics right in your mailbox.
Depending on the LinkedIn analytics tool you choose, you can also get many more benefits to make it easier to achieve sales targets on LinkedIn.
In a competitive social space where there are so many companies presenting their best self to achieve business goals, a professional picture and several praiseworthy accolades alone won’t cut it for you.
This makes it essential for you to leverage the right third-party analytics tool to make data-backed decisions when it comes to your LinkedIn marketing strategy. The ultimate benefit? A higher ROI.
Top 7 LinkedIn analytics tools
Thinking of going for a LinkedIn analytics tool? Here’s a list of 7 of the best LinkedIn analytics tools you can choose from:
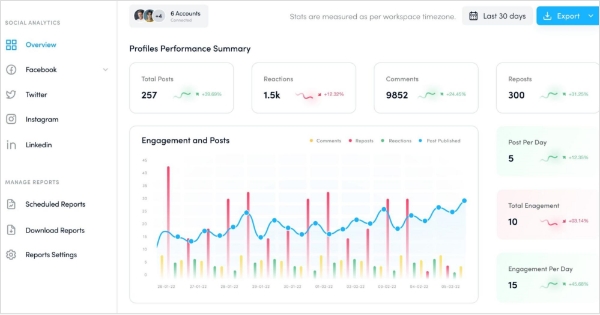
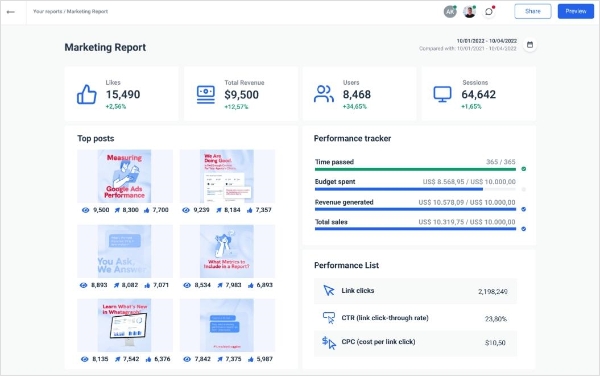
ContentStudio is a post scheduling as well as analytics software for meeting all your social media marketing needs at one place.
The tool offers engagement statistics as well as comparative analysis. With it, users can compare the performance of their social channels against one another and monitor competitors, too.
ContentStudio also enables customizable, pre-scheduled, and automated reporting.
This isn’t all, as with ContentStudio you can also identify your top posts on LinkedIn and top trends in the industry.
Pricing is pretty reasonable, starting at just $19 a month.
- Shield Analytics
Shield is a tool specifically designed for organic LinkedIn growth. The software pulls out content and audience related metrics in real-time.
A unique feature Shield offers is that it alerts you when your connections have shared a major update such as a job switch. This way, it enables opening up conversations to build stronger connections.
Another good feature is that users can filter data so that it is more comprehensible.
However, a major downside of this app is that it doesn’t integrate with other social channels. This means you don’t have all your social media related data in one place.
Shield is available for free for 10 days only. However, the starting price point isn’t too high at $6.
- Klipfolio
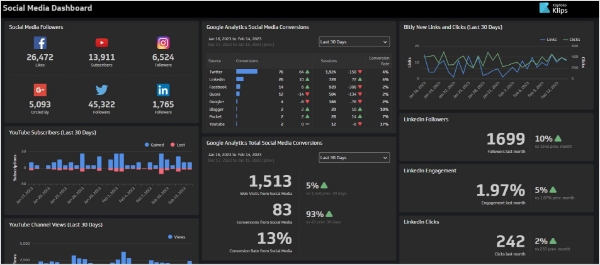
Klipfolio is another analytics tool for improving your LinkedIn marketing that provides detailed and exact insights that you can easily import, edit, measure, and use on the spot.
Unlike Shield, this tool can connect to hundreds of applications. Apart from social media accounts, you can connect your Klipfolio dashboard to Microsoft products as well as other apps such as Databox and Picmonkey.
This tool offers customizable and professional looking dashboards but only provides two color customizations — light and dark.
Klipfolio is pretty costly with pricing starting from $90.
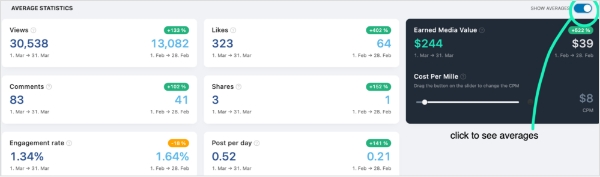
- Whatagraph
Whatagraph is a reliable LinkedIn analytics tool that provides cross-channel reports.
It offers live customer service, a feature that not many reporting software offer. Whatagraph also integrates with a number of applications. Moreover, the reports you create using this tool aren’t only automated but you can also include custom branding and logos.
The con? Whatagraph can be a bit complex to use.
It is also on the pricier side, starting from $223 per month.
- Talkwalker Analytics
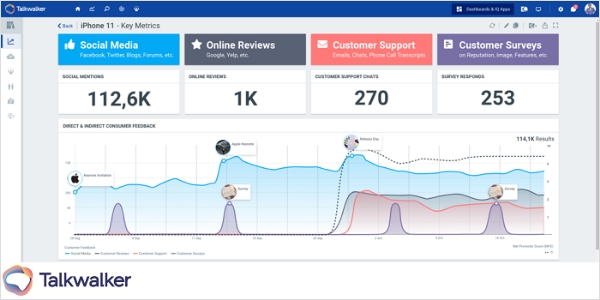
Talkwalker offers insights for your online, social as well as television, radio, and print content.
It gives quick as well as detailed insights into customer behavior and engagement. Additionally, it enables audience segmentation as well as competitive analysis, and offers formattable reporting.
Users can easily integrate Talkwalker but it can take some getting used to because of the complicated user interface.
- Unmetric
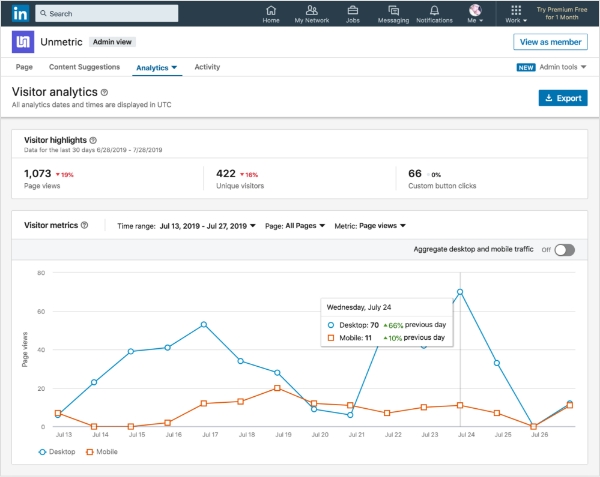
Unmetric uses artificial intelligence to analyze and compare your social media performance.
This tool enables you to set benchmarks which is how it helps you stay ahead of your game. It analyzes what is working for your competitors and how your campaigns are performing in contrast.
Unfortunately, you can only track a limited number of competitors using Unmetric.
That said, Unmetric offers content research, content ideation, and automated reporting too.
It’s quite expensive, though, with pricing starting at $300 per month.
- Keyhole
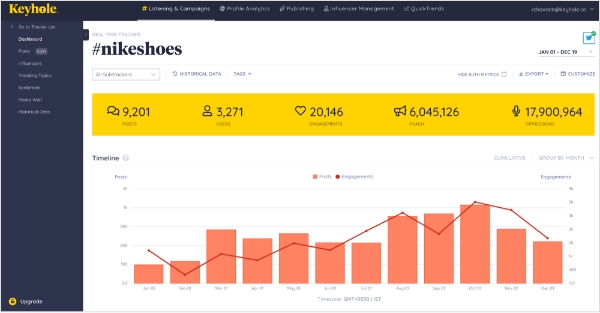
Keyhole is a real-time LinkedIn analytics tool that also offers analytics for other social media channels.
This tool delivers content and campaign-related insights. Users can also use Keyhole to compare their performance on different channels.
This software is user-friendly enough for those who are new to it. However, its chat support is quite poor, which is a drawback.
Using LinkedIn analytics for shaping an effective marketing strategy
To recap, tracking LinkedIn’s built-in analytics is your solution to finding how well your LinkedIn marketing strategy is doing and to measure and refine your efforts on the platform.
If you want deeper insights, third-party LinkedIn tools can help as well.
ContentStudio is one valuable tool for analyzing your content performance on LinkedIn as well as other social media accounts. With it, you can make data-informed decisions to grow your social media presence and achieve your LinkedIn goals. The tool doesn’t just offer analytics but also automated publishing, content curation, and a unified social inbox — making it easier for you to achieve your LinkedIn growth goals.
In short, it’s an all-in-one social media management solution. Sign up to get started today.
Also Read: Guide to using LinkedIn for business in 2025
FAQs
Is LinkedIn analytics free?
LinkedIn has an in-app analytics tool that users can access for free. The native Analytics available reports on standard metrics including engagement, followers, impressions, and visitor metrics for organic and paid content. Tracking these analytics helps measure and improve your LinkedIn performance and strategy.
Can you see analytics on your personal LinkedIn?
Whether you have a personal LinkedIn profile or a company page on LinkedIn, you can access in-app analytics on your dashboard. Analytics are available for personal profiles at the bottom of the dashboard. You can also find analytics for individual posts right under each post.
How to calculate engagement rate on LinkedIn?
To calculate the LinkedIn engagement rate, simply add the total likes, comments, and shares and divide it by the number of posts. Divide the number that you get by the number of followers, and then multiply it by 100 to get your average engagement rate.
Subscribe to our weekly newsletter!
Join over 14,500+ agencies and brands to stay informed with weekly social media updates, blogs, strategies, and expert tips right into your inbox!
Recommended for you