As Facebook is the largest and the most popular social media channel, if your content/ social media marketing strategy is nailing it on this platform, you are guaranteed success.
ContentStudio gives you an in-depth analysis of all that is happening with your social media posts on Facebook. The data is presented in a comprehensible way to allow you to make sense of the results of your Facebook content.
From the top left, select the Facebook account for which you want to see the statistics. From the top right, select the time period.
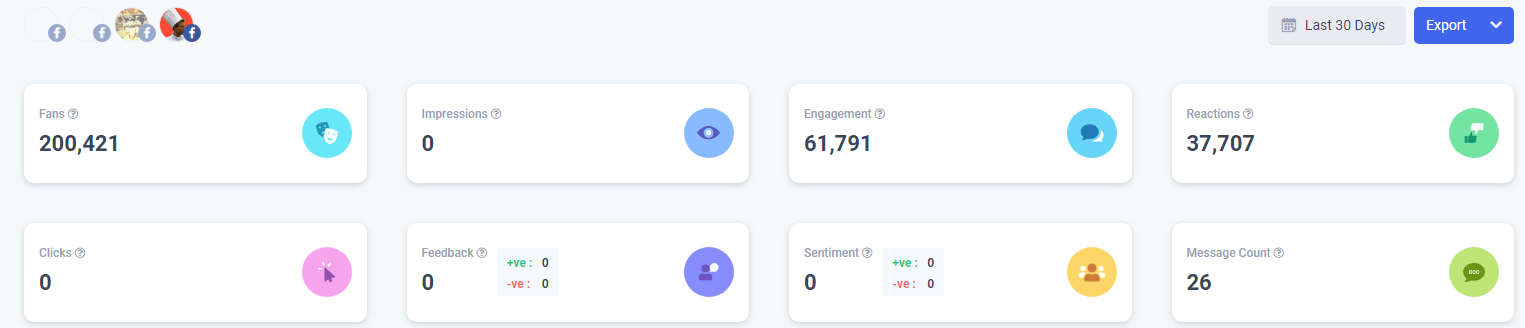
The Facebook analytics dashboard greets you with a bird’s eye view of the most crucial attributes of your social media ROI evaluation. These are discussed below.
Fans: A Facebook fan is a user who likes a particular Facebook page. Users who Like a page are able to receive updates from that page’s administrator through status updates, posted content and event invitations.
Impression: Impressions are the number of times a post from your page is displayed. For example, if someone sees a page update in their Facebook newsfeed and then sees that same update when a friend shares it, that would count as 2 impressions.
Engagement: Facebook engagement is an action someone takes on your Facebook Page or one of your posts. The most common examples are likes, comments, and shares, but it can also include checking in to your location or tagging you in a post.
Reactions: A couple of years back, Facebook released their new ‘Reactions’ feature, which means instead of just having the option of ‘Liking’ a post, users can now interact with a status update, article, or photo using one of six emotional reactions: Like, Love, Haha, Wow, Sad, and Angry.
Clicks: Facebook defines Link Clicks as “the number of clicks on links within the ad that led to destinations or experiences, on or off Facebook.” So, while link clicks are more focused than the Clicks (All) metric, they still include clicks on any links, whether they take people on or off of Facebook.
Feedback: Feedback is the measure of positive response VS negative response. This means you see a ratio of how many people react with positive emotions and how many negatives ones such as dislike or angry.
Sentiment: Sentiments on social media are the cumulative perception of positive or negative moods being expressed on social media posts or engagement.
Message count: Message counter shows the total number of messages received for a particular Facebook account.
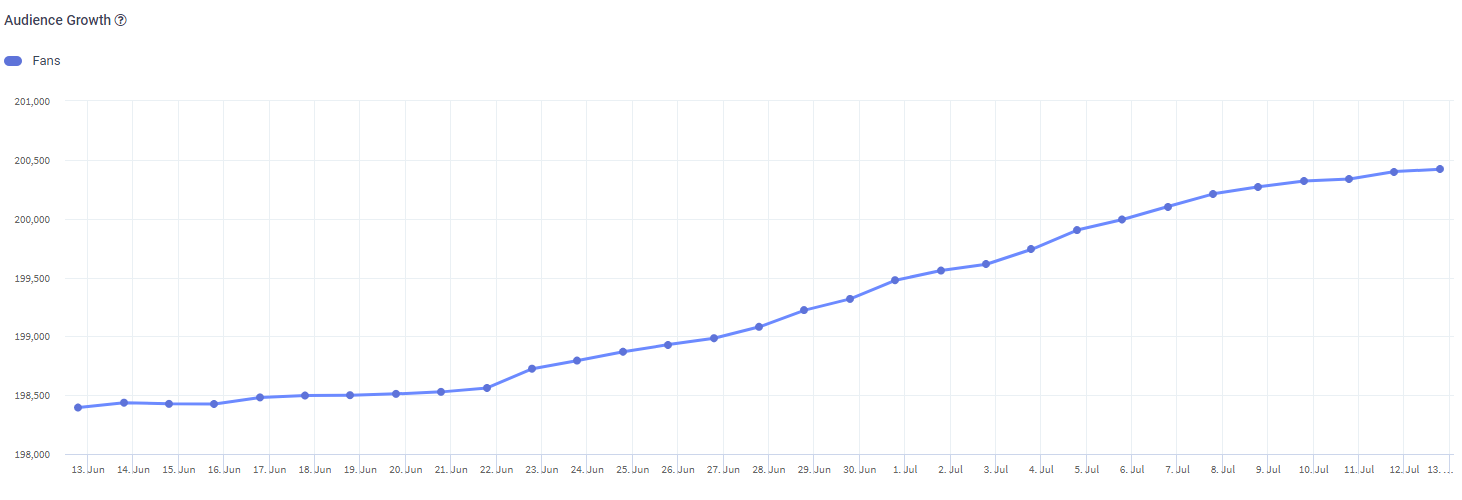
Audience Growth
This is one of the most important attributes to measure the growth of your Facebook channel. How your audience growth is progressing is the true reflection for how well your social media strategy for a particular Facebook page is performing.
For a successful marketing strategy, your audience growth graph must be always increasing. This way you know that the content you are producing resonates with your audience.
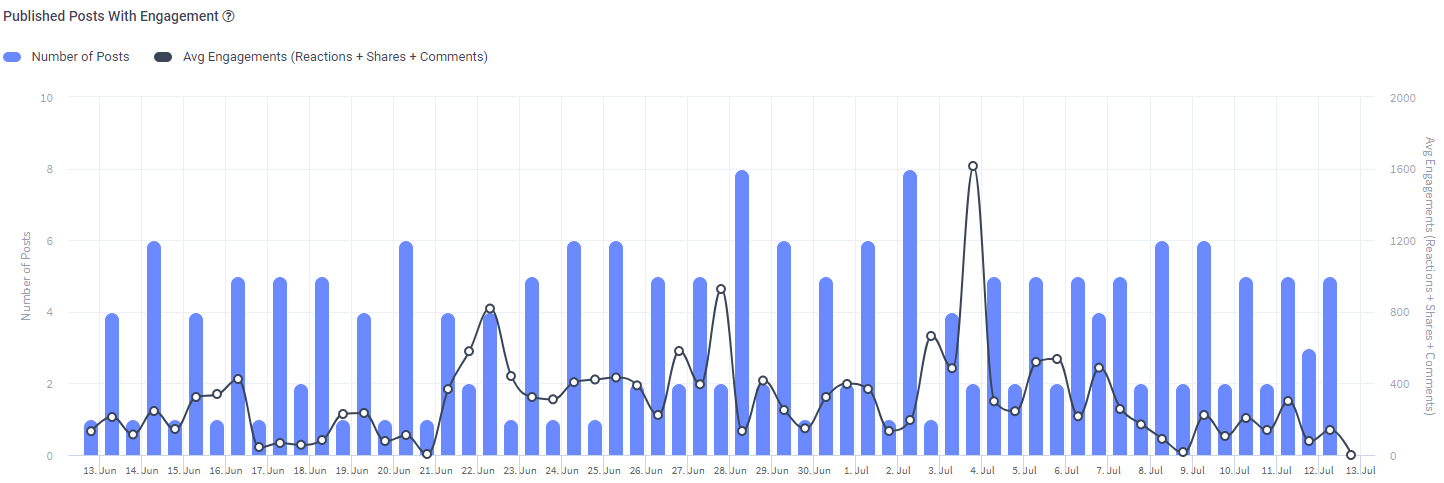
Published posts with engagement
This section is an elegant combination of three of the most important attributes to measure the success of the content you share. These are the number of posts, the frequency of posting and the average engagement of each day. All this information is wrapped up and presented to you in the form an elegant graph with time on “X” and the number of posts on the “Y” axis.
You can also see the average engagement of each day in a sinusoidal waveform. This gives you an overall picture of how your Facebook content is performing. Based on this data you can alter the posting frequency and time/ date of posting.
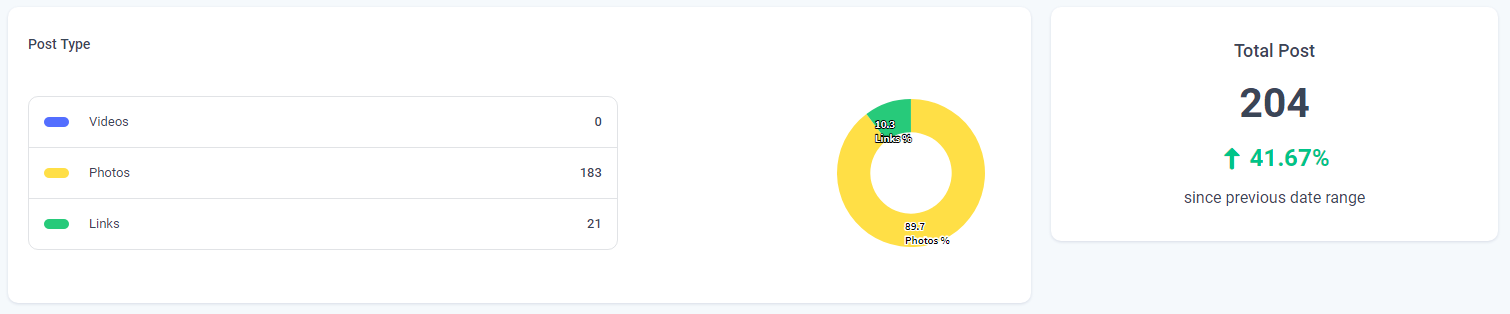
Post Rate
This section shows the type of content you are posting. Each industry and its audience requires a special type of content to which they are attracted to. You have to cater to the needs of your audience and feed them the right type of content.
Similarly, with the rapid increase in the demand for video content, it is absolutely necessary that you keep the right mix of video content in your overall strategy. This graph will teach you which type of content your audience is more susceptible to consume. Whether it is text, visual or pictures.

This information is also presented in a pie chart showing the percentage type of content being posted. Also, it shows the total posts and the percentage if posting whether it is going up or down. This graph is labeled as post type.
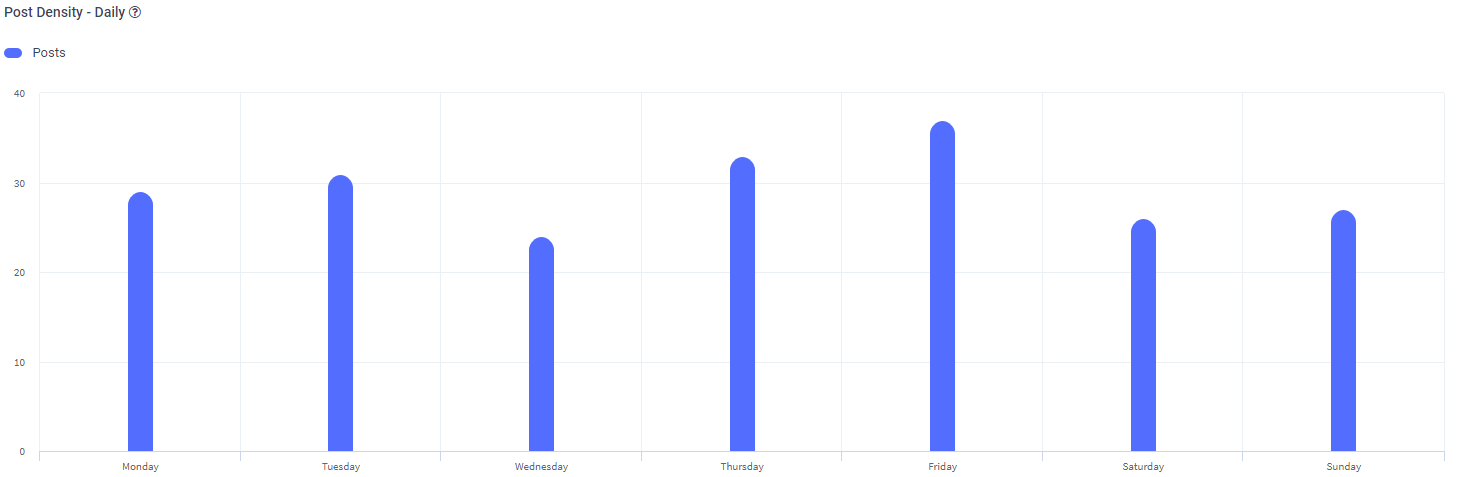
Post Density
Post density shows the number of posts you are publishing daily. You can compare this data with the engagement against each day of the week to determine how the posting frequency is affecting engagement. It is now necessary that posting more content will always mean more engagement.
Fans identification w.r.t age and sex
This data is extremely helpful to people who want to market content to a specific segment of the population. Attributes such as age and gender are very handy for precise targeting.
It’s important to know the mindset of the buyer in order to better present your content. People in different age groups respond to different sets of information presented in a unique manner. Similarly, male and female viewership tend to differ in their choice of colors, content, and information.
Combine this with the knowledge of the time of posting will give you an in-depth analysis of your content marketing strategy. You can then tweak and customize your content to better suit the interest of your audience.
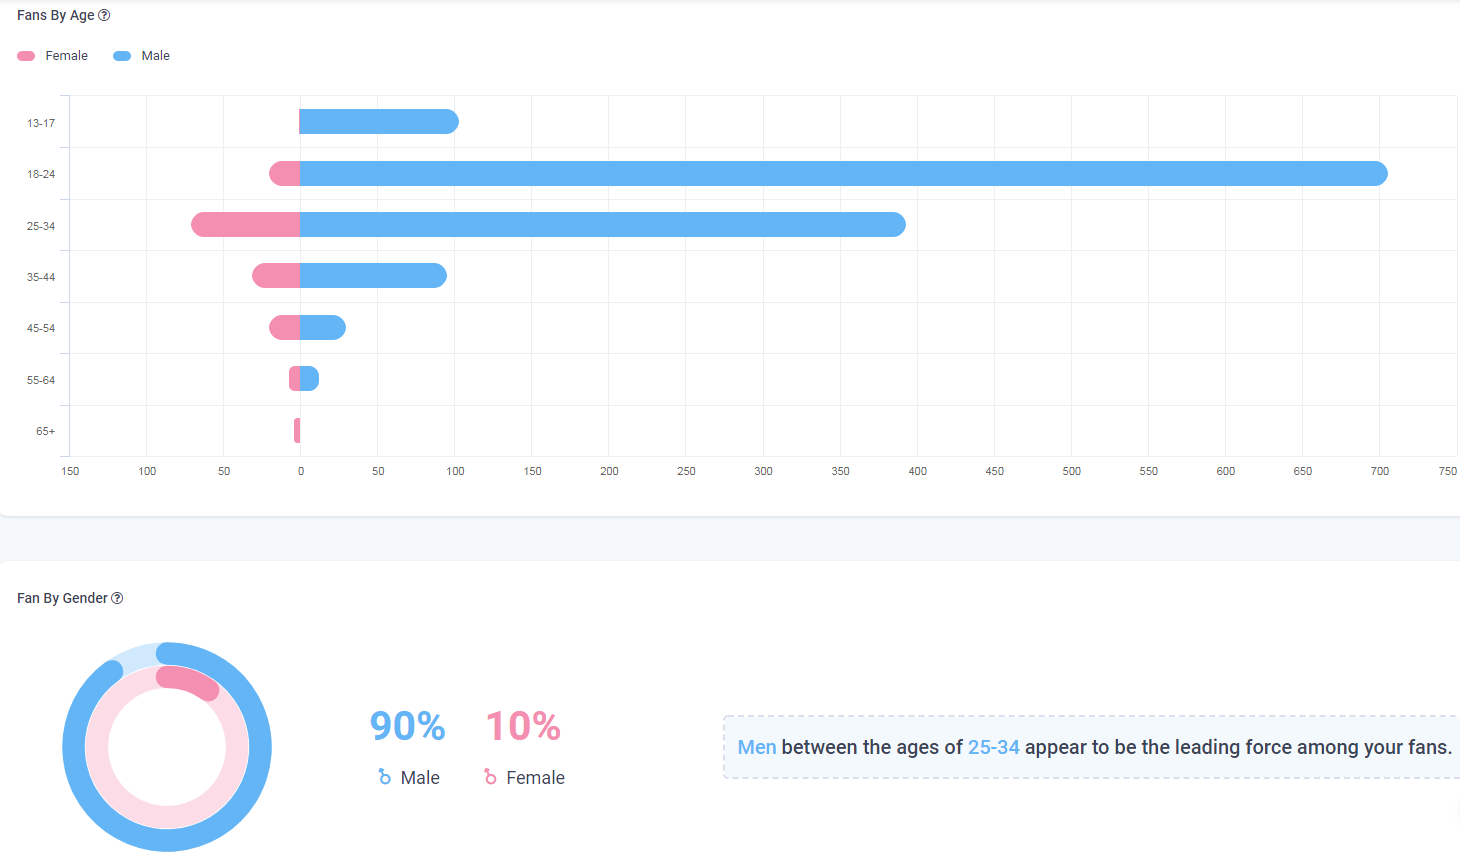
This information is especially helpful when crafting content for people of different ages groups. As research shows, the attention span of millennials is far less than that of older people. Hence, whereas you can create infographics and short videos for your younger audience, you need to share detailed articles for the ones used to reading newspapers.
Top Countries
You might have 20k members in your group, yet the engagement could be very low. A partial reason for this might come down to the simple fact that much of your audience is not able to relate with the content you are sharing.
Culture, language, and demographics play an important role whilst determining engagement. If you can share content relevant to a country or city, your audience is more likely to read, share and like it. ContentStudio analytics helps you in categorizing your audience w.r.t their demographics.
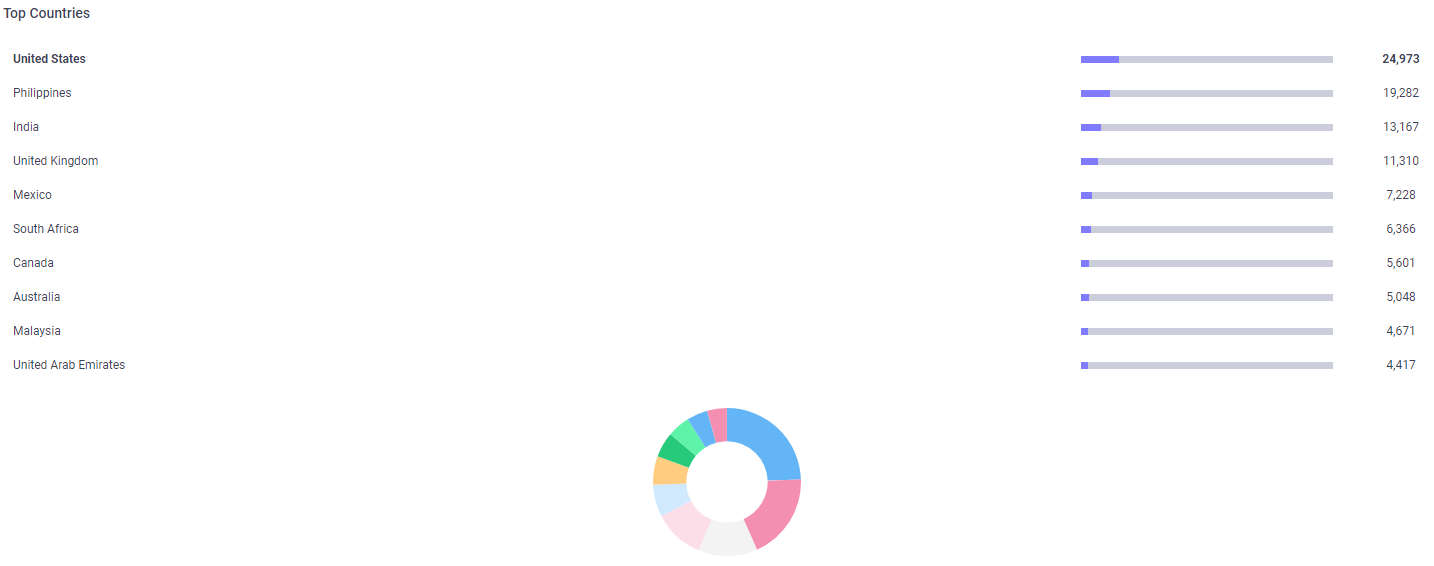
Sharing local news, sports updates and politics news will generate the interest of the audience. You can also mix the content up so all of your group members are happy. Clicking on the “Show All” button expands the category and shows each member’s country of origin.h
The demographics analytics also shows the top languages being spoken by your team members. As you must know, ContentStudio has the ability to discover content from a wide variety of languages. Using this functionality you can share content in the language spoken by the majority of your Facebook page members.
Page Impressions by Day
Facebook page impressions are the total views a Facebook page receives in a given time frame. For example, if someone sees a page update in their Facebook newsfeed and then sees that same update when a friend shares it within 24 hours, that would count as 2 impressions.
There are 2 ways your Facebook page is viewed, one organically and other through paid advertisement. The organic impression is the number of times people visit your page through natural search.
The page impressions are broken down into different categories, which include page views, unique page views, total tab views, and external referrers.
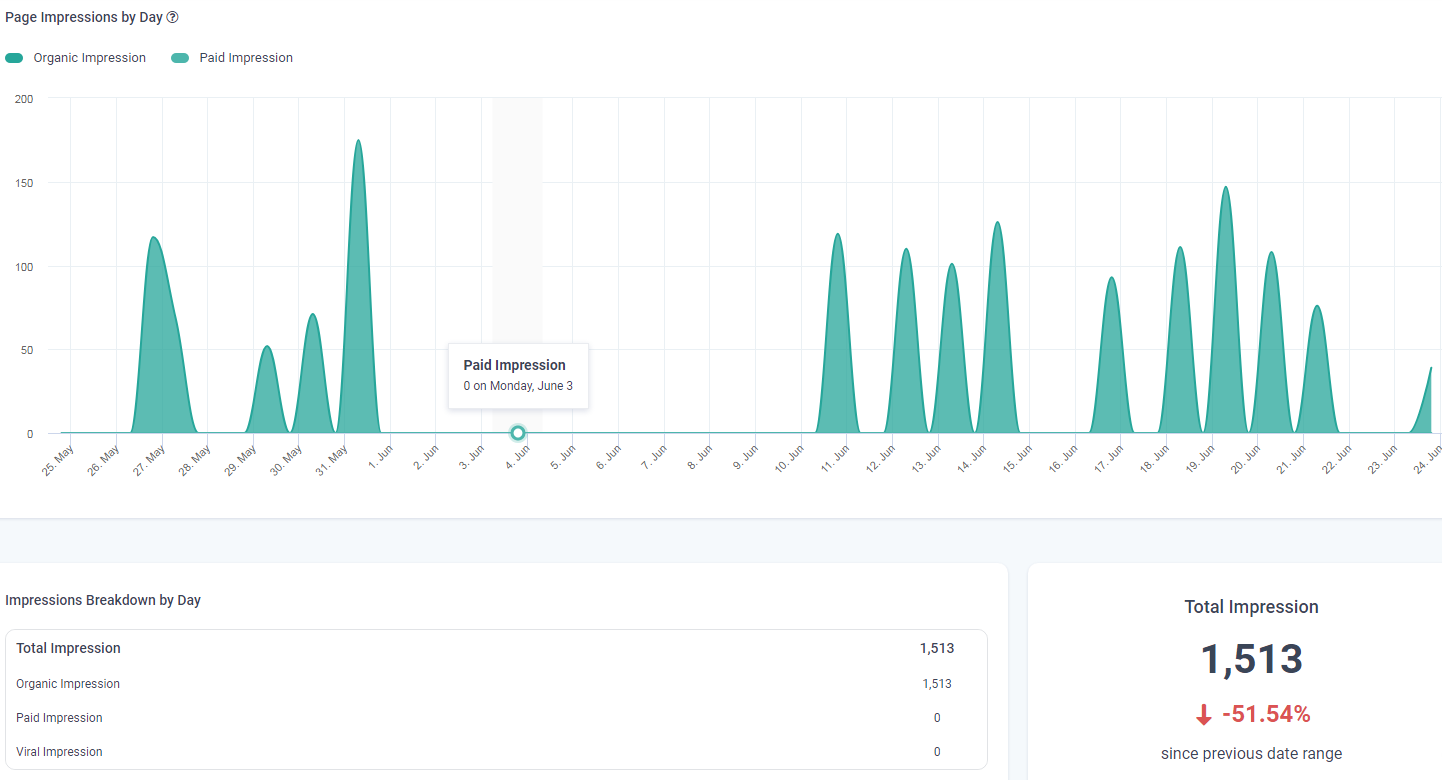
ContentStudio social analytics give you insights as to which days your page is more visible compared to others. This tracking metric is a more accurate way to see how many people are visiting your page on a daily basis.
Video Analytics
As the name suggests, the video analytics sections consist of statistics specific to the video content being published on your Facebook pages or groups.
Video content is getting popular day by day and according to a study, 55% of consumers want to see more video content from the brand they support. In the same research, it was noted that a massive 87% of marketing professionals use video as a marketing tool.
Hence, it was imperative that we brought video analytics for our users. The video analytics sections consist of the following parameters.
Paid Views
Video ads allow you to show off your product, service or brand using a video. You can create video ads in Ads Manager or boost a post from a Facebook Page that includes a video. Paid views are the view you receive against the video ads.
Total Engagement
This is the likes, comments, shares, and saves your video content receives.
Click to Play
Clicks to Play tell you how many times your video started playing after someone clicked it.
Organic Views
Organic video views highlight the number of times your video content is viewed which does not contain paid content e.g. ads. These videos may include product/ services videos, educational videos, etc.
Autoplay
This shows how many times your video was autoplayed in the newsfeed of your audience.
Active Users by Hours/ Day
A marketer is as good as the information they get based on which an overall marketing strategy is designed. This section of social analytics shows the best time of the day as well as the ideal day of the week to post content. You can then share the most interesting content in these slots to extract maximum engagement.
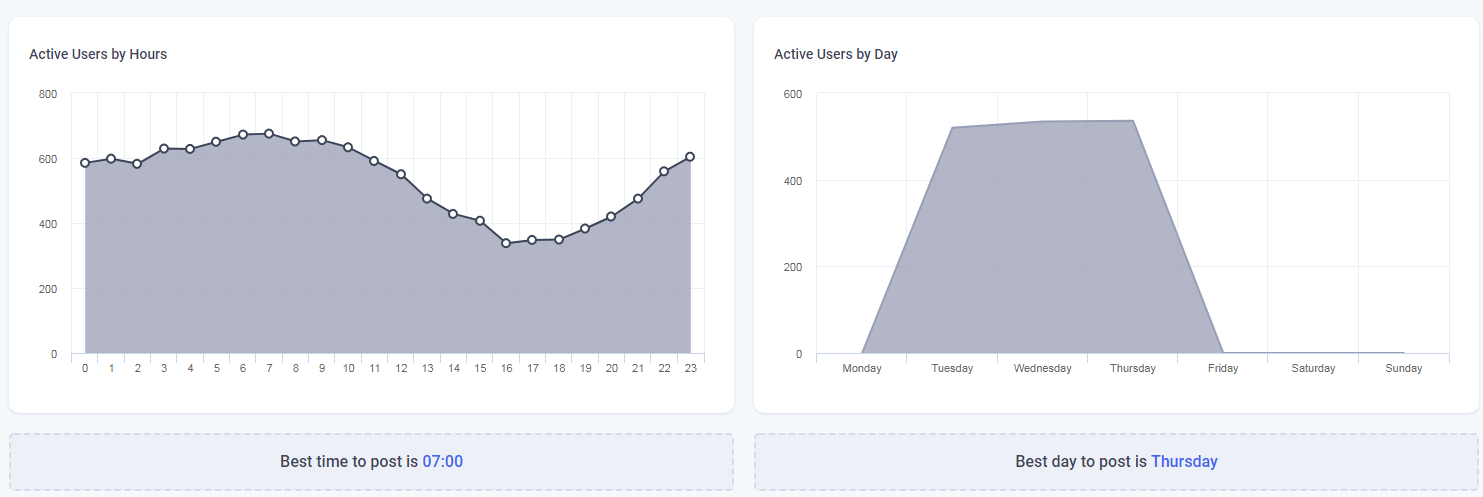
Keep in mind that your group members will be from different time zones all around the world. You have to choose the appropriate posting time when most of them are online and active. This gives a better chance of your content being noticed.
Engagement Rate
Engagement rate is the combined number of comments, reactions, and shares your posts receive on a daily basis. It is very hefty to see what kind of reactions are you getting against the posts. Also, which days your audience is more active and responsive against when they are not.
You can also pair this graph with the type of content you are posting to check whether videos, photos or articles are getting the best response.
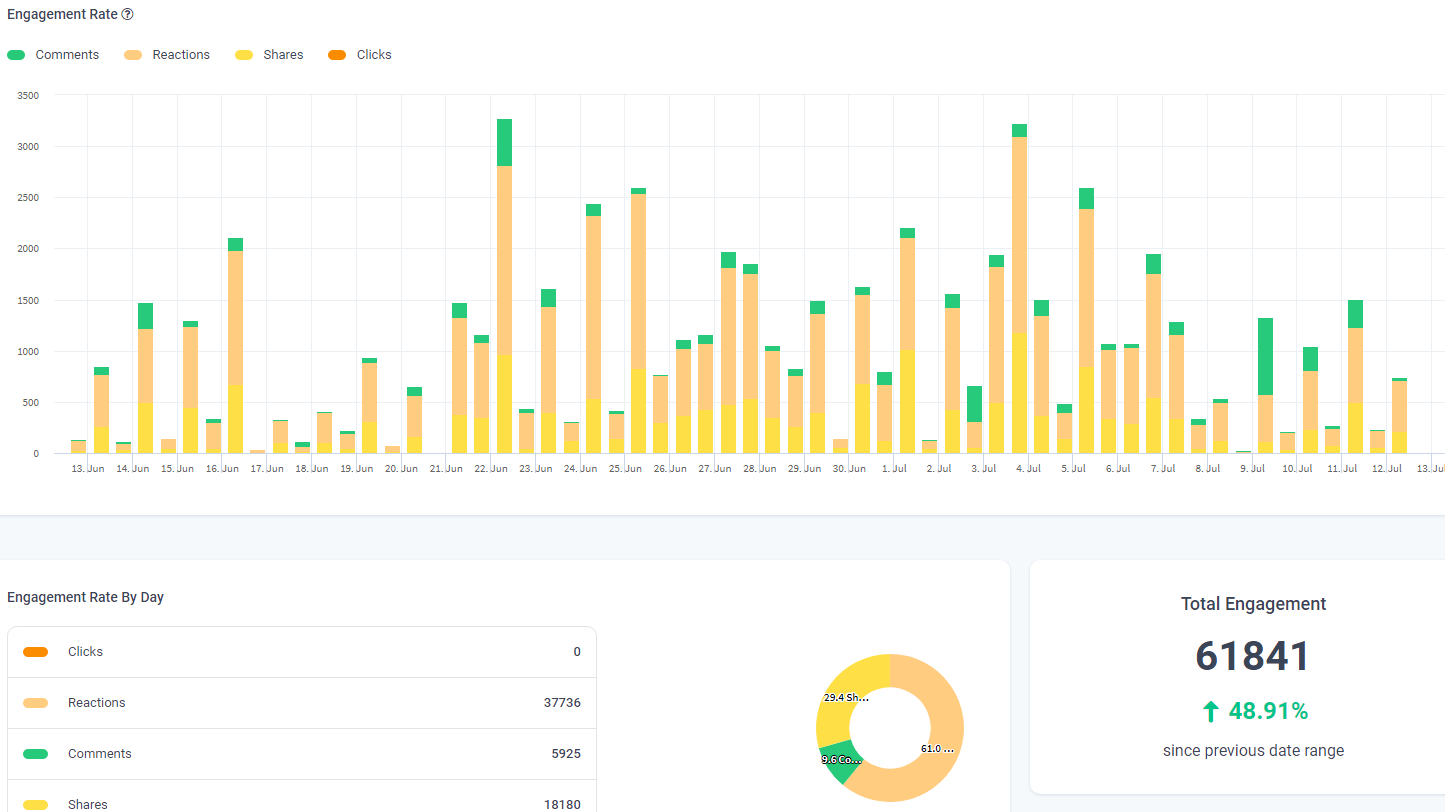
This helps you visualize whether the type of content you are sharing is working or not. Analyzing the trend you can see if the overall engagement rate is increasing or decreasing.
Let’s paint a scenario. You have 7 money keywords on which the digital marketing strategy of your business relies on. You discover, plan and share content focused on each of the keywords and schedule the content for each day of the week. Now from the engagement rate, you can see which keyword is performing well compared to others and you can focus more content related to that keyword.
Reactions Overview
People love to get reactions to the content they share. ContentStudio platform records those reactions for you. This section shows the combined reactions such as like, love, cray, and angry, which all post have received in a defined period for a particular Facebook page.
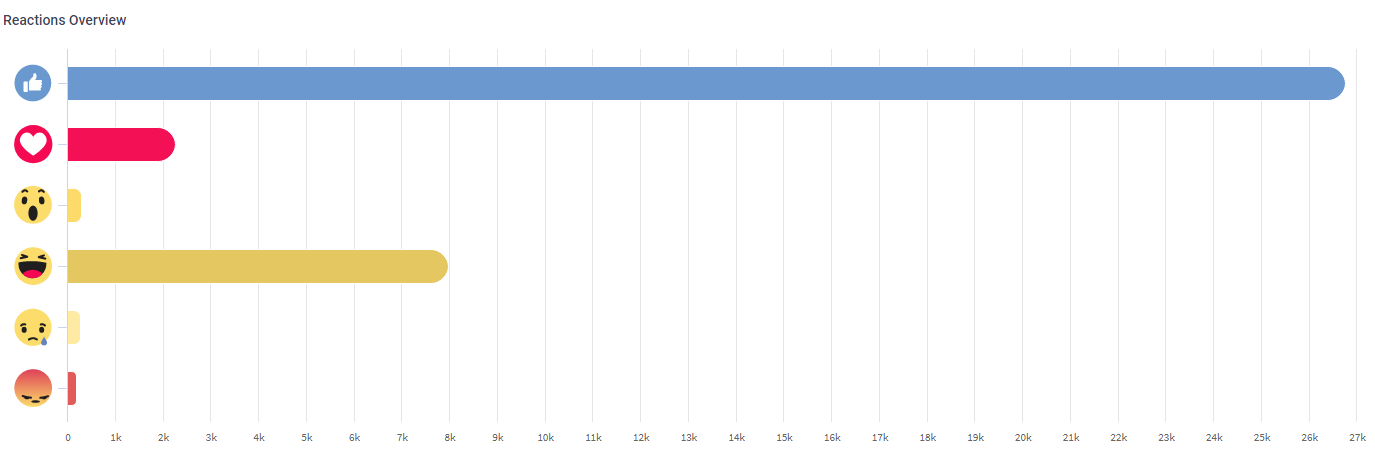
The pointer here is that the reactions should match the type of content you are sharing. E.g. if the nature of your content is funny there should be more laughs than say angry or crying.
Engagement by Day/ Time
This is a great way of knowing which time of the day is your audience more active. This will help you significantly in scheduling content at the perfect time. Remember your audience can be from all over the world and sometimes it gets really tricky to schedule content at the right time because most of them might be sleeping and will miss the post.
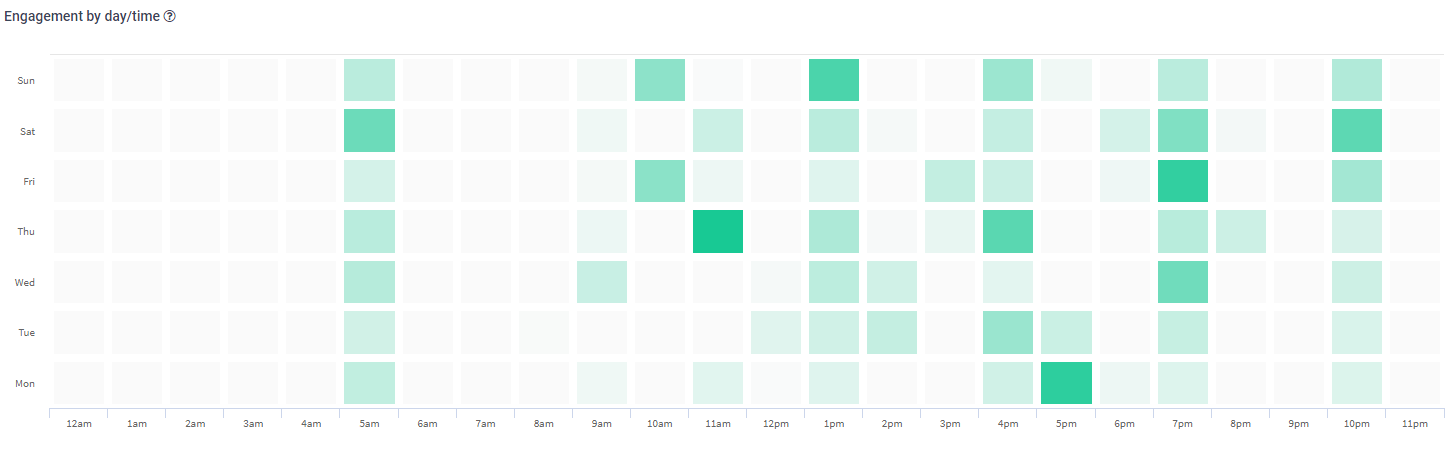
People might also be busy on the first working day i.e. Monday and may avoid using social media, so you may want to converse more engaging content for later in the week.
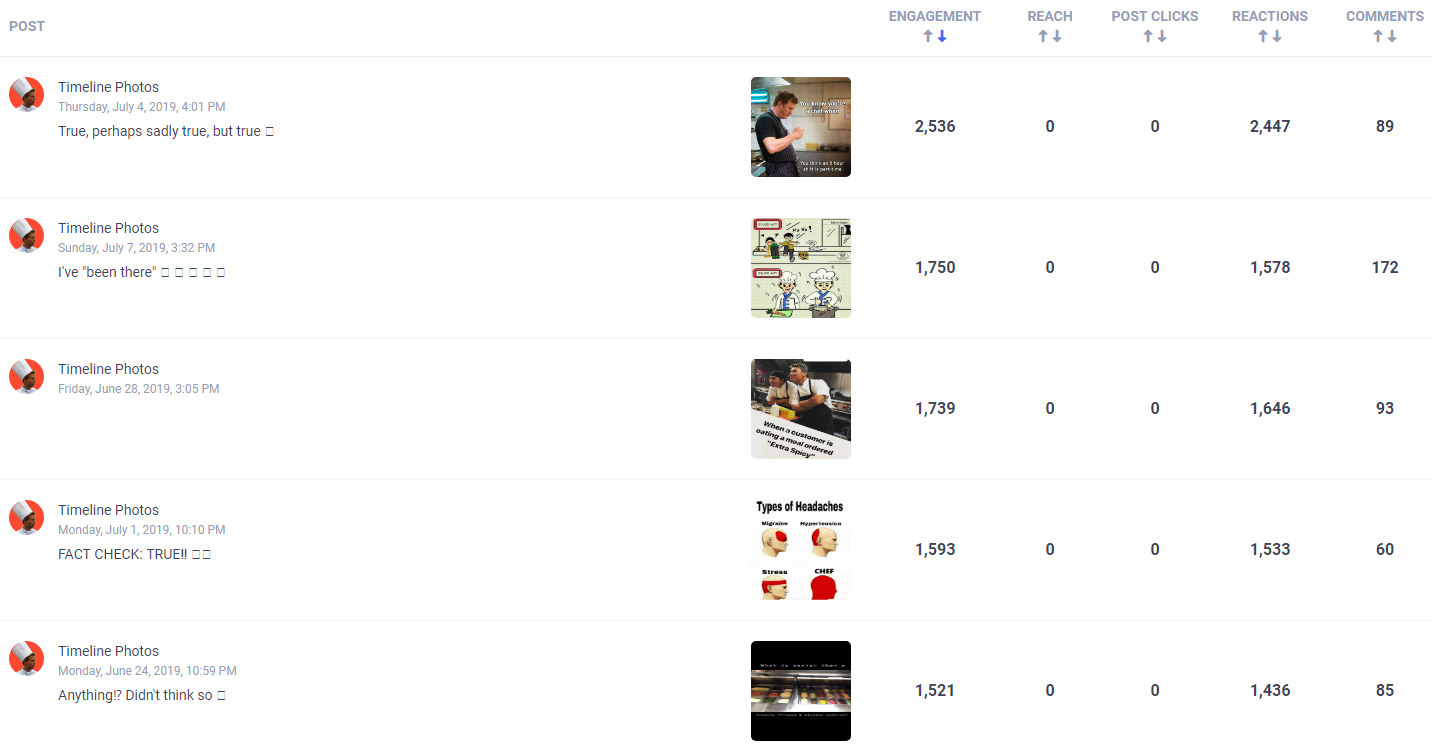
Top Posts by Engagement
This section is essentially a detailed report on how each post compares against others. Each post is evaluated for engagement, reach, post-clicks, reactions, and comments. The posts are then arranged in an order of your choosing to inspect its performance e.g. ascending or descending w.r.t engagement, reach, post clicks, reactions, and comments
This concludes all the Facebook analytics ContentStudio has gathered for you to make informed decisions about how to alter your Facebook marketing strategy to gain more fans, following, and engagement. Let us know what you think in the comment section.

Wasiq Naeem
Wasiq Naeem is a content and digital marketing veteran who is passionate about his writing. Extensive research and producing high-quality content is just another day at the office for him.