Twitter analytics from ContentStudio help you break down your Twitter activity and gain powerful keyword, hashtag and demographic insights. You can also choose the time period for which the accumulated data is shown. There are also quite a few options to export this data in the form of PDF reports.
Twitter analytics provide a summary of your profile and shows you how it has performed in terms of profile visits, follower growth, and tweet impressions. It also gives you an analysis of the impressions your tweets are getting, as well as details on engagement, i.e. retweets, mentions, favorites, and clicks. You can export all the data and run some pretty neat reports for yourself.
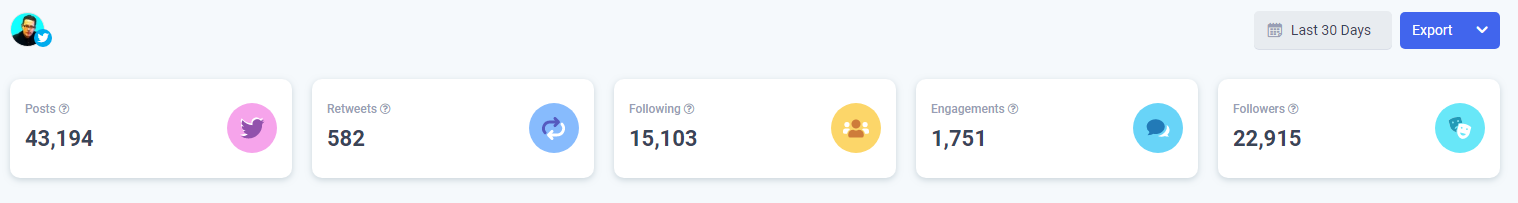
Retweets
A Retweet is a re-posting of a Tweet. Twitter’s Retweet feature helps you and others quickly share that Tweet with all of your followers. You can Retweet your own Tweets or Tweets from someone else. Sometimes people type “RT” at the beginning of a Tweet to indicate that they are re-posting someone else’s content.
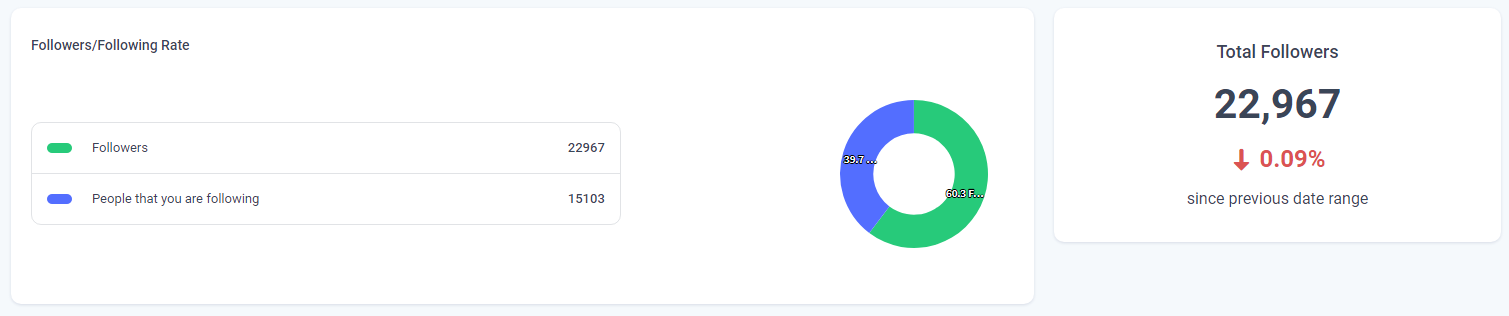
Total Following
This shows how many Twitter accounts are you following. Every Twitter account is able to follow up to 400 accounts per day. Every Twitter account can follow up to 5,000 accounts. Once you reach that number, you may need to wait until your account has more followers before you can follow additional accounts.
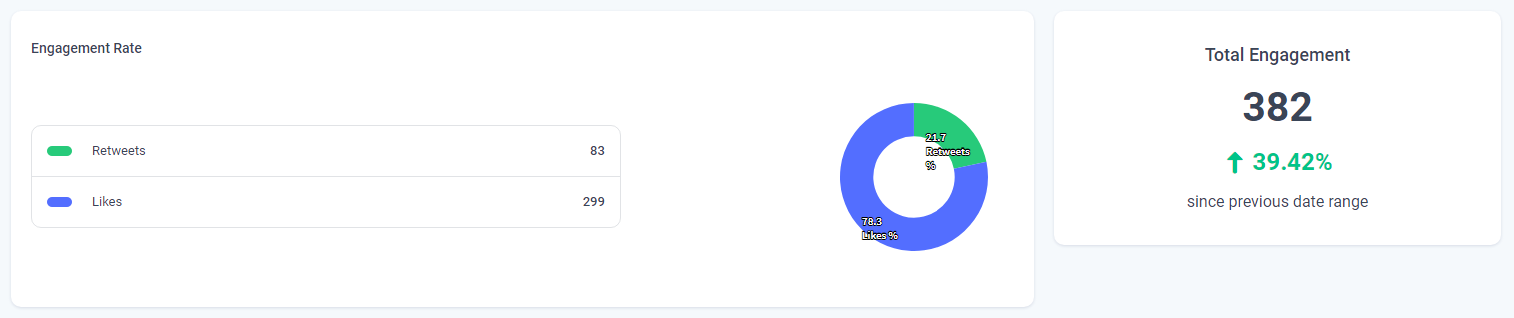
Total Engagements
The total number of times a user interacted with a Tweet. Clicks anywhere on the Tweet, including Retweets, replies, follows, likes, links, cards, hashtags, embedded media, username, profile photo, or Tweet expansion.
Total Followers
This number signifies the number of people who follow your content and page updates.
Total Posts
It is the accumulative number of tweets and links you share with your audience.
Published Posts With Engagement
This is a nifty graph shows the number of tweets you have posted versus the engagement you have received. The X-axis of the graph shows the time. So you can see how many tweets were made on a particular day and how much average engagement they received.
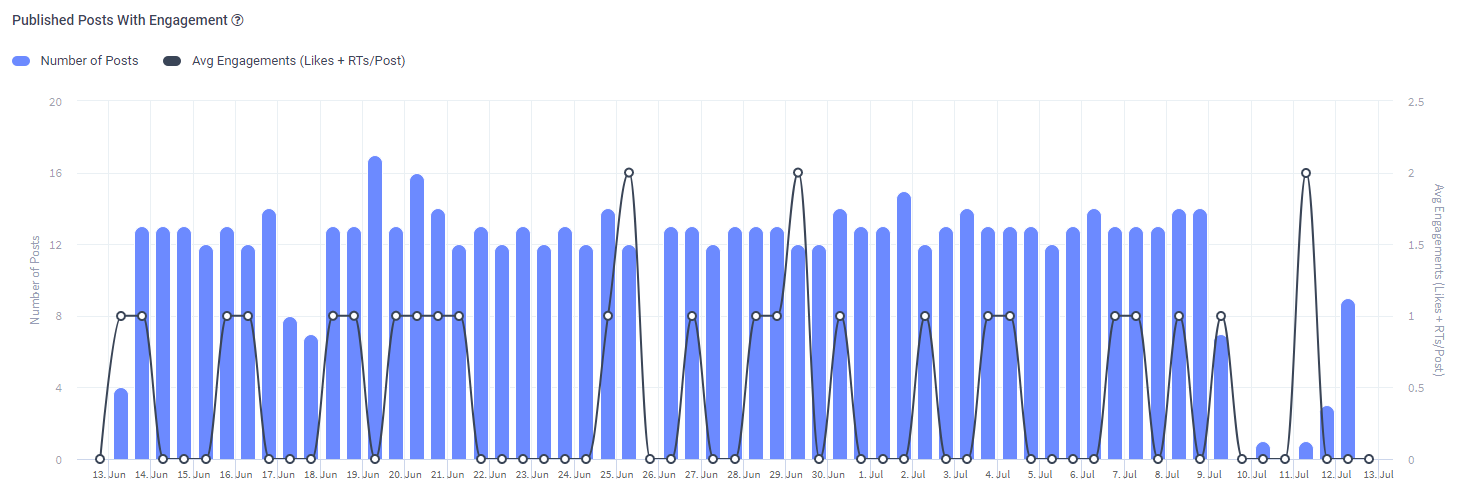
The engagement consists of likes plus retweets and shares.
Engagement
This is a statistical graph of likes and retweets. It is advisable to always share content which is more likely to be retweeted. This, in turn, will generate more likes.
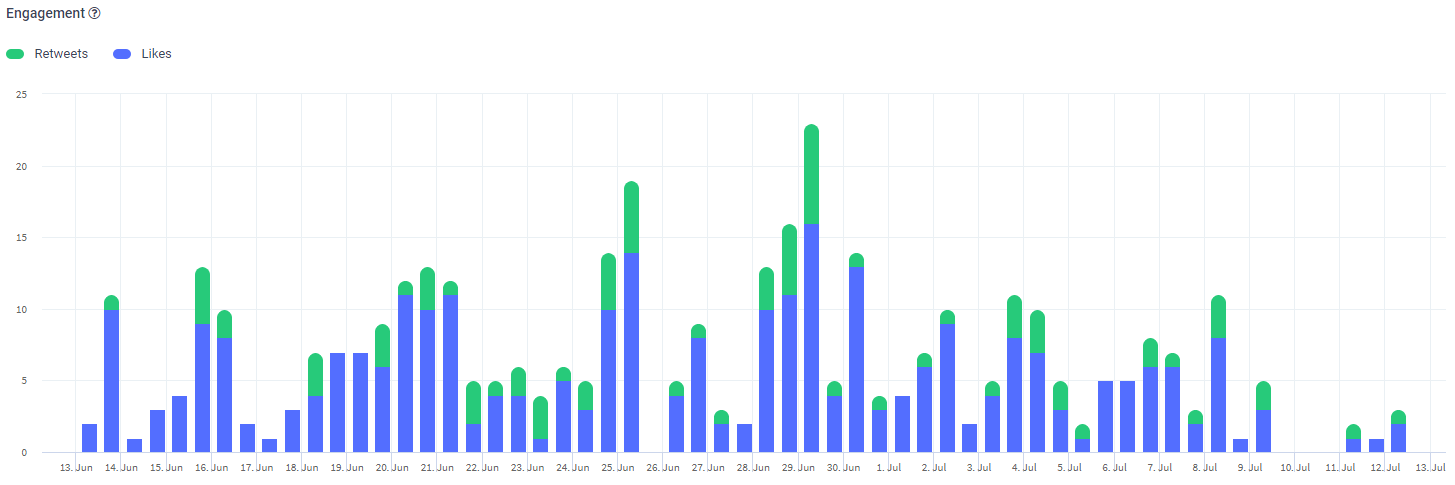
This show exactly how many likes and retweets your posts received on a given day. You can then try and determine a pattern of when to tweet what kind of content to gain maximum engagement.
Similarly, you can see the engagement rate in the form of a pie chart and see if the overall engagement is positive or negative.
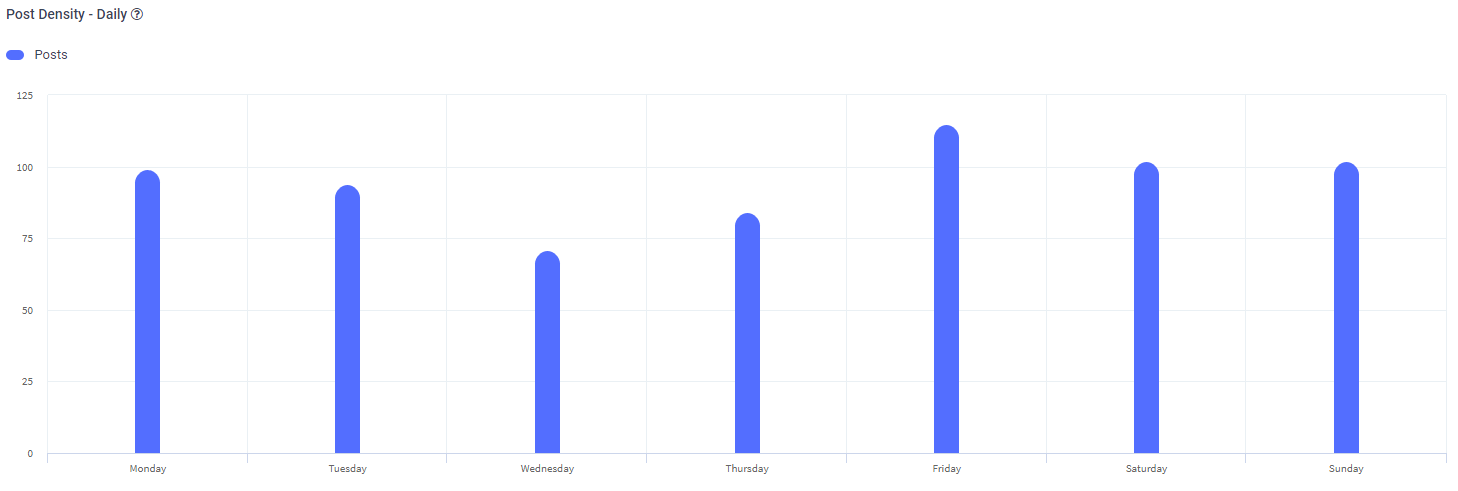
Post Density
Post density is simply the number of tweets per day.
Audience Growth
Knowing your audience is the key rule for success for every social media marketer. An appreciation of demographic variables such as age, gender, household income, language, and geography will help create engaging content. 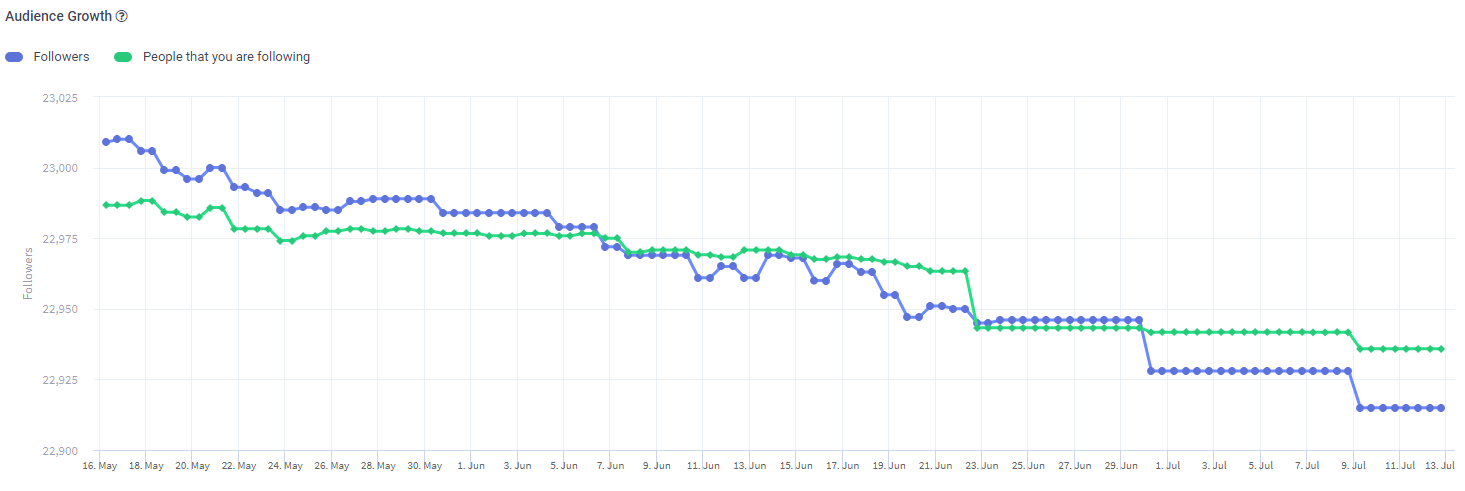
The audience growth graphs create a mental picture of how your fan following and the people you are following is progressing. The people following you should always be greater than the people you follow.
There should be a steady increase in the people following you and this can only be achieved by designing and sharing content which resonates with your audience.
Awareness through Mentions
Mentions are a great way of knowing the popularity if your channel. @Username, When people use the term “Twitter mention,” this is usually what they’re referring to. A mention is when someone uses the @ sign immediately followed by your Twitter Handle.
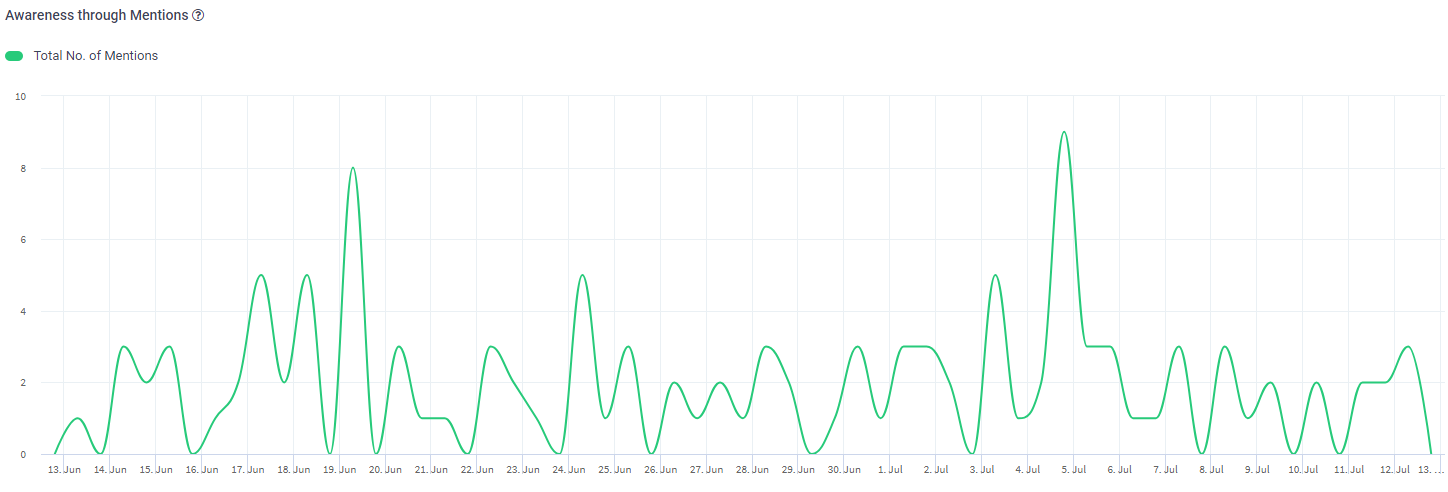
Tracking mentions is very effective when it comes to evaluating brand performance on Twitter. It is also a means for tagging brands and getting instant attention.
Top-performing Hashtags by Engagement
Another common way that people mention brands on Twitter is with a hashtag, especially if your brand is well known. People use the hashtag symbol (#) before a relevant keyword or phrase in their Tweet to categorize those Tweets and help them show more easily in Twitter search. Clicking or tapping on a hashtagged word in any message shows you other Tweets that include that hashtag. Hashtags can be included anywhere in a Tweet.
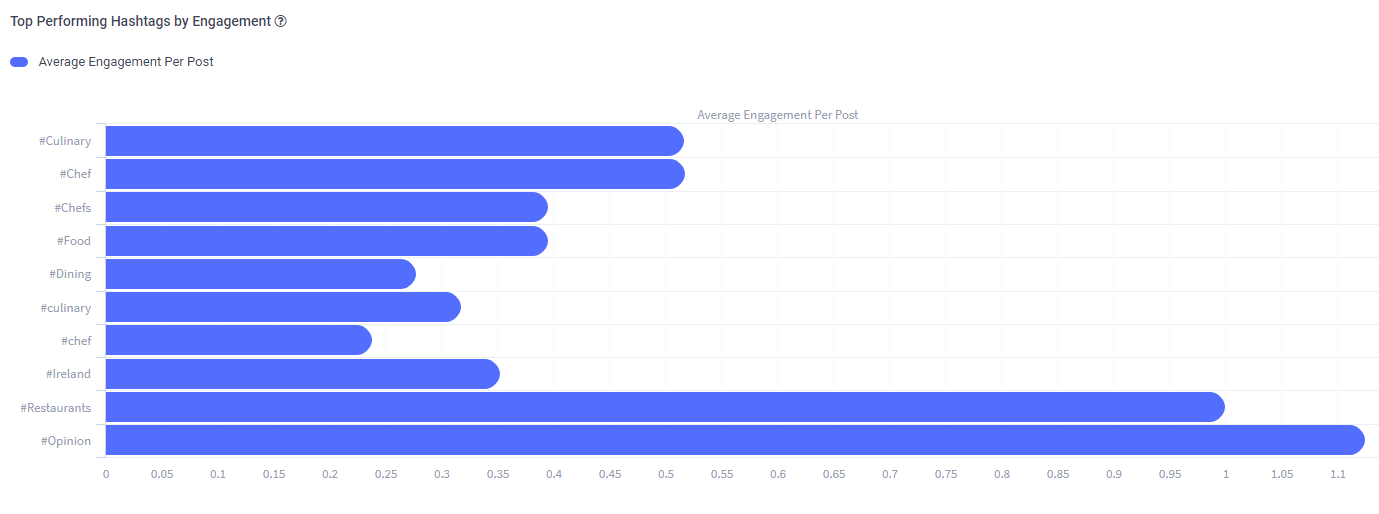
The Hashtag engagement evaluator shows you how much engagement have you received for a particular Hashtag. You can then concentrate on the ones generating more traffic and create posts around them
Twitter analytics also has engagement by day/ time and top posts by engagement the same as in Facebook analytics.

Wasiq Naeem
Wasiq Naeem is a content and digital marketing veteran who is passionate about his writing. Extensive research and producing high-quality content is just another day at the office for him.