ContentStudio’s latest dashboard is a workspace-based tab containing day-to-day charts and graphs to understand your social media performance. These charts help to understand your social media analytics and team’s progress.
It’s a good reference point to find data to get a quick overview of your projects. Manage insights from all social media without wasting time and resources. You can now rely on Dashboard to give you a bird-view of your social media progress.
Here’s what Dashboard Shows:
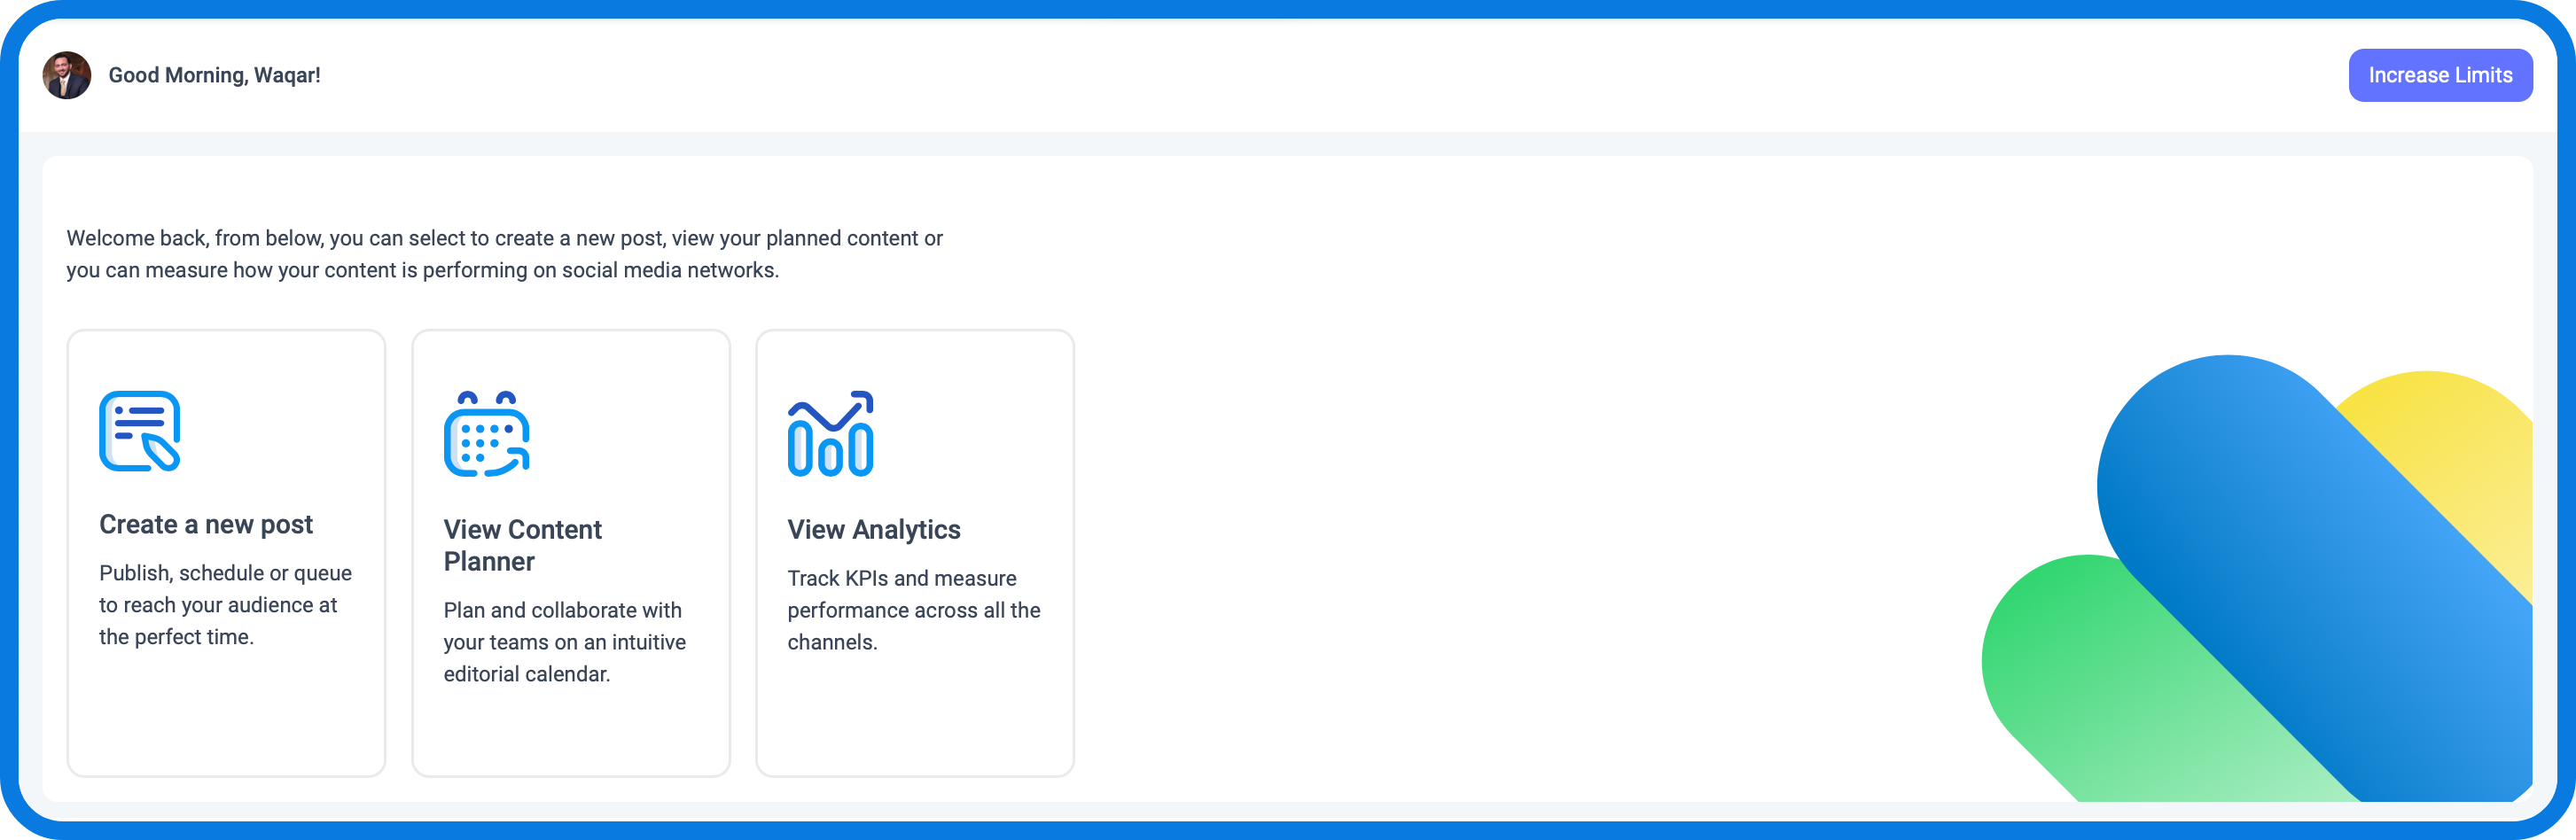
After logging in, the users will be redirected to the Dashboard (instead of Content Discovery) where they will be able to:
- Increase account limits.
- Create a new social/blog post
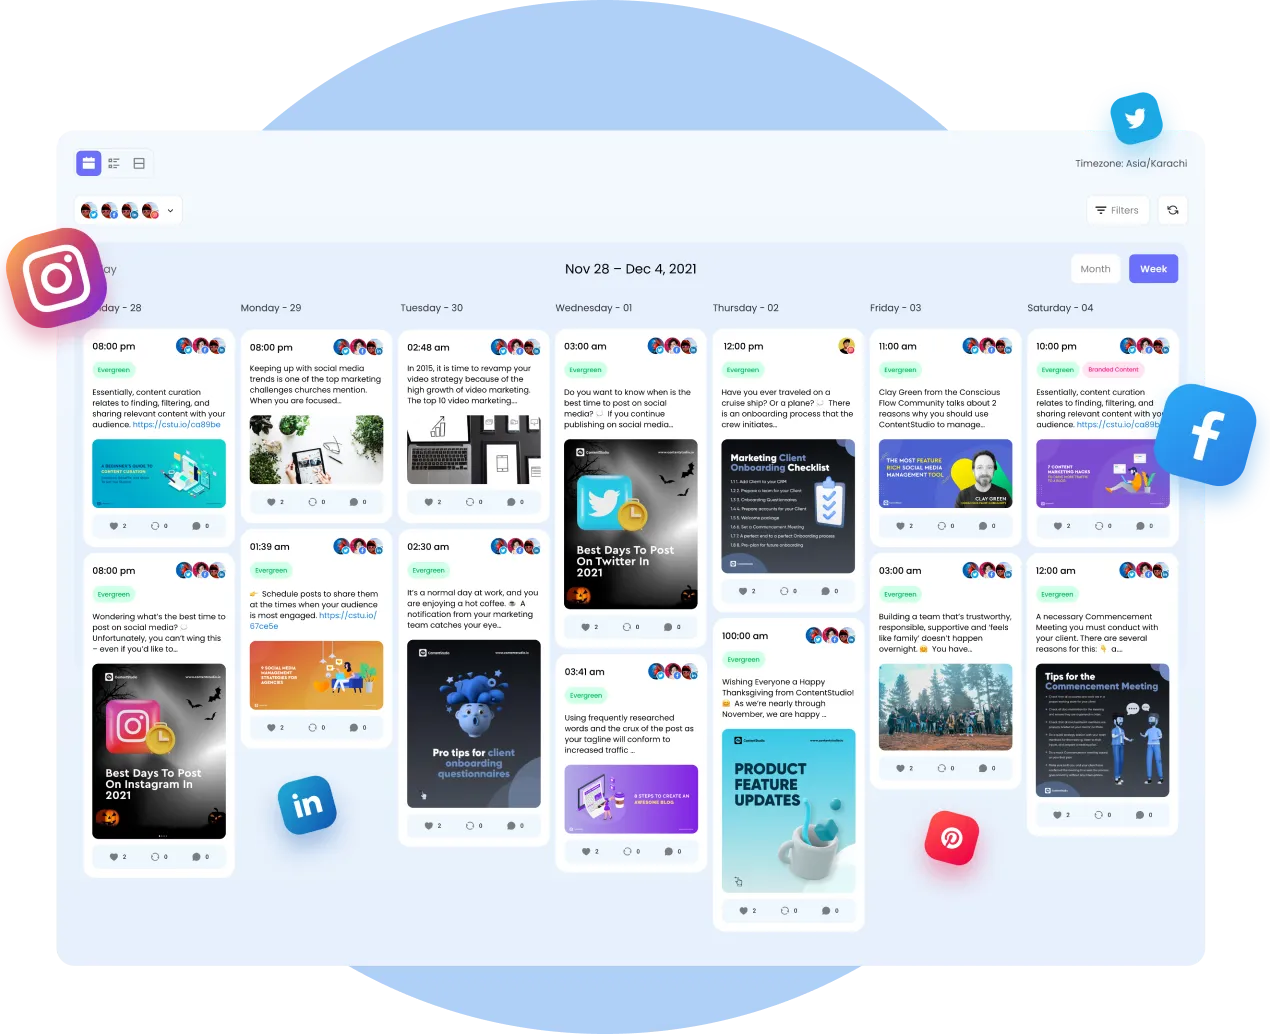
- View content calendar to monitor all the content that has been scheduled
- Evaluate in-depth post-performance metrics in Analytics.
1. High-level Overview of Social KPIs
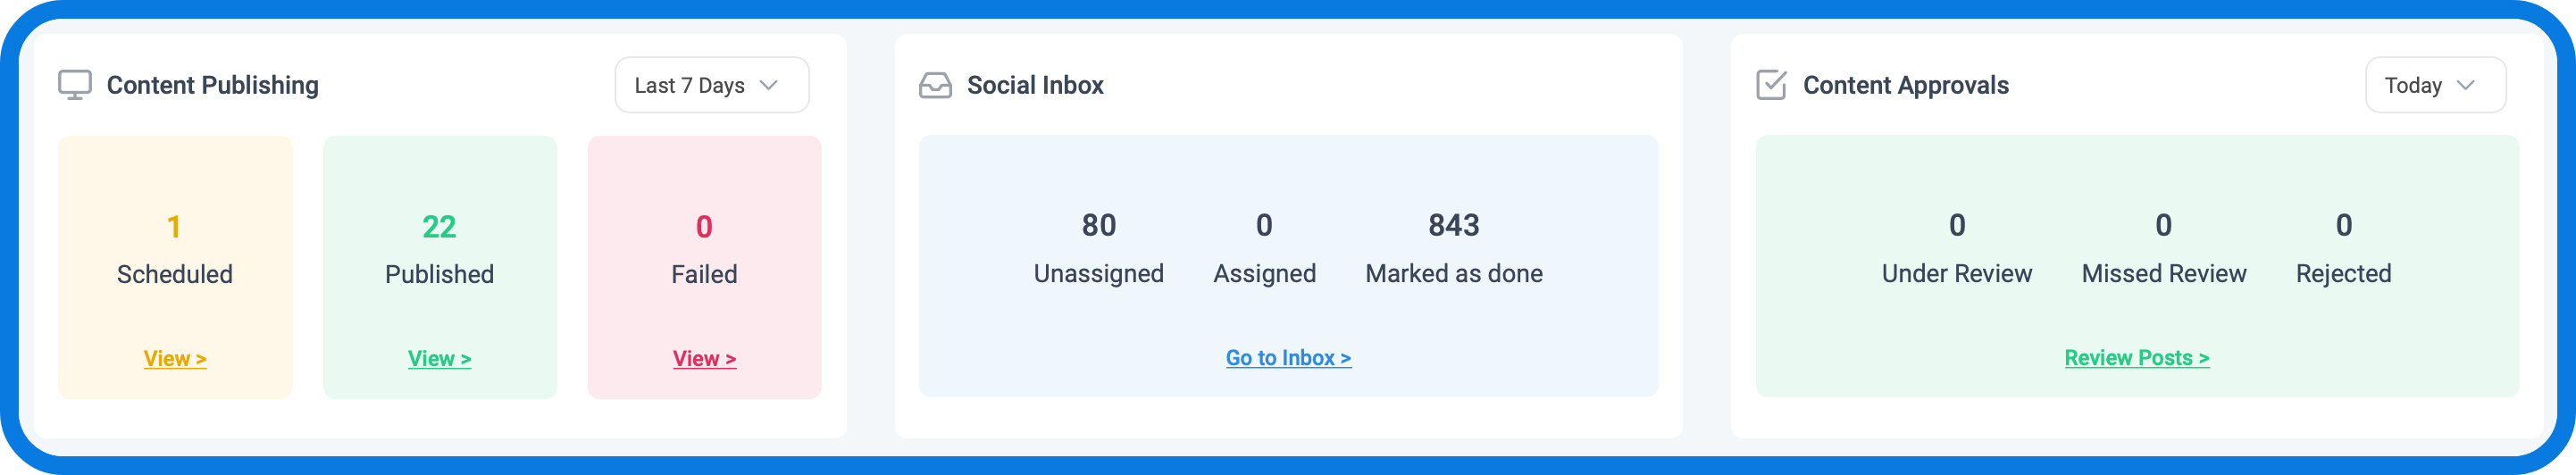
Get a quick sneak peek on your Content Calendar:
Social media managers, this one’s perfect for you! As the first task of the day, you can see what your content looks like for the day.
- How many posts (and what kind of posts) have been scheduled today, yesterday, or last month.
- What have been the causes for the failed posts, if any? Work on those in the future!
- How many social messages have you received today?
- Are there any posts under review?
- Which posts got rejected by your clients? If so, what has been the common reason?
2. Analyze Engagement Across Social Networks:
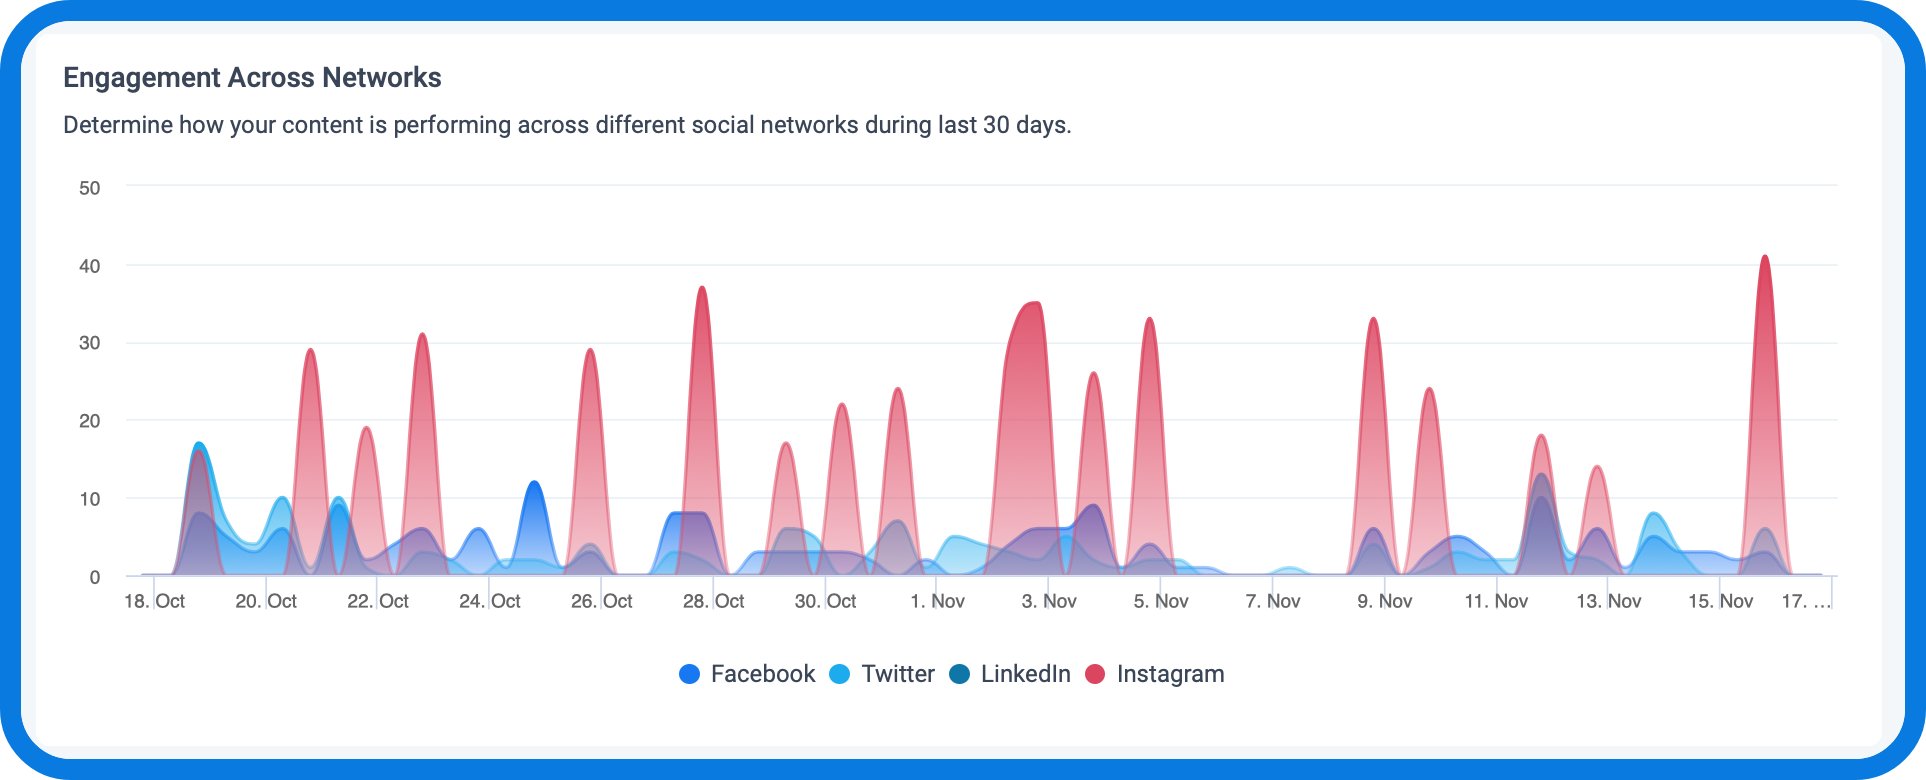
We have meshed all your socials together, so you can inspect data per channel or all together. These graphs answer the following questions:
- Which platform is performing most effectively for your brand?
- Where should you focus your efforts more?
In this case, Instagram has shown high levels of engagement with respect to other platforms! By comparing and analyzing overall social strategies across networks, you can gain critical insights to understand your performance. For example, what makes your strategy at Instagram successful? You can also determine which social media needs more attention!
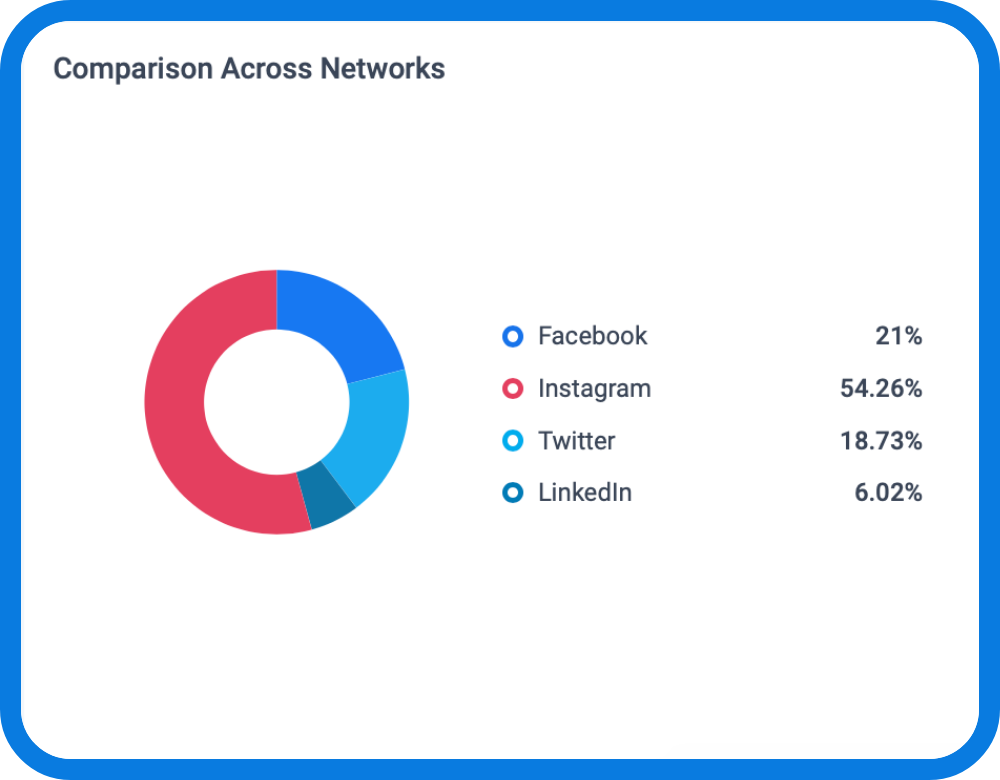
Similarly, you can view your progress in the doughnut-chart as follows:
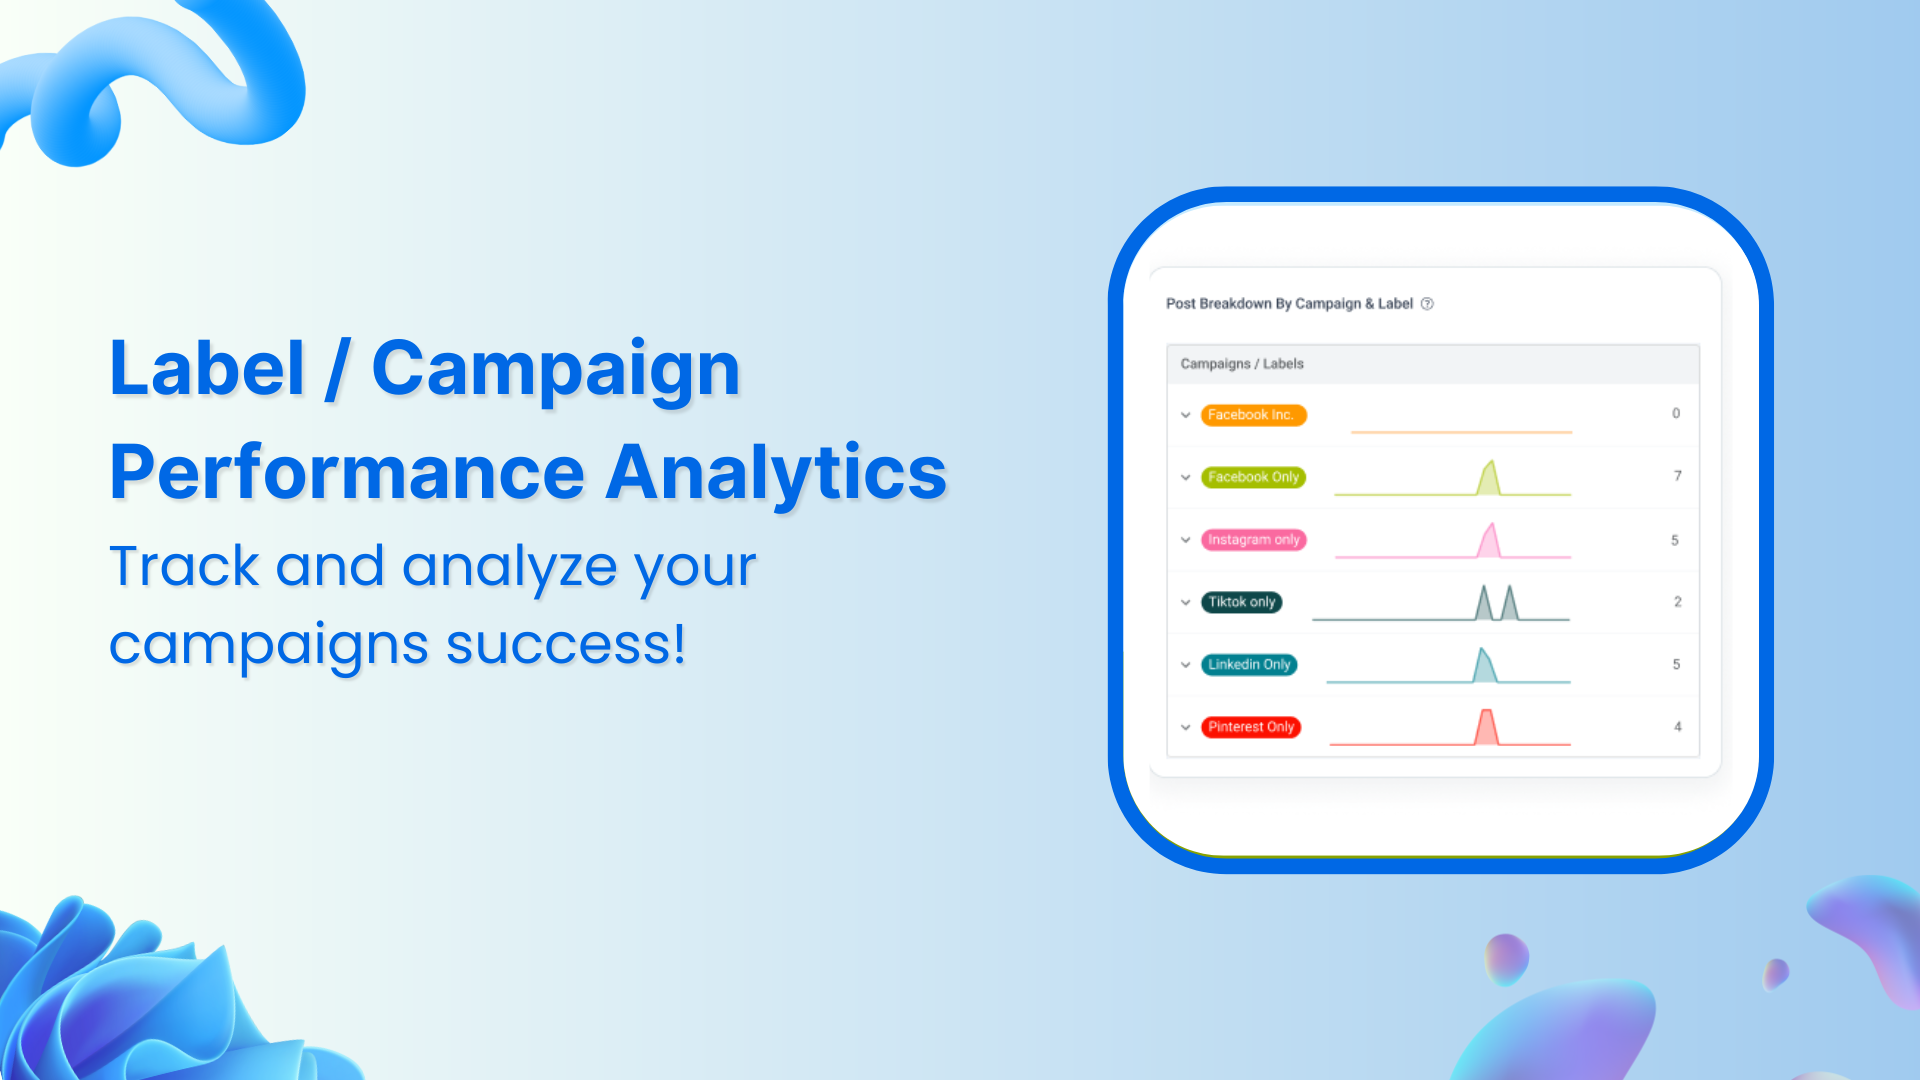
3. Social Posts with Highest Engagement

Study top posts for social networks by viewing metrics like engagements, comments, shares. Advanced analytics metrics are available in Analytics.
4. Shortcuts
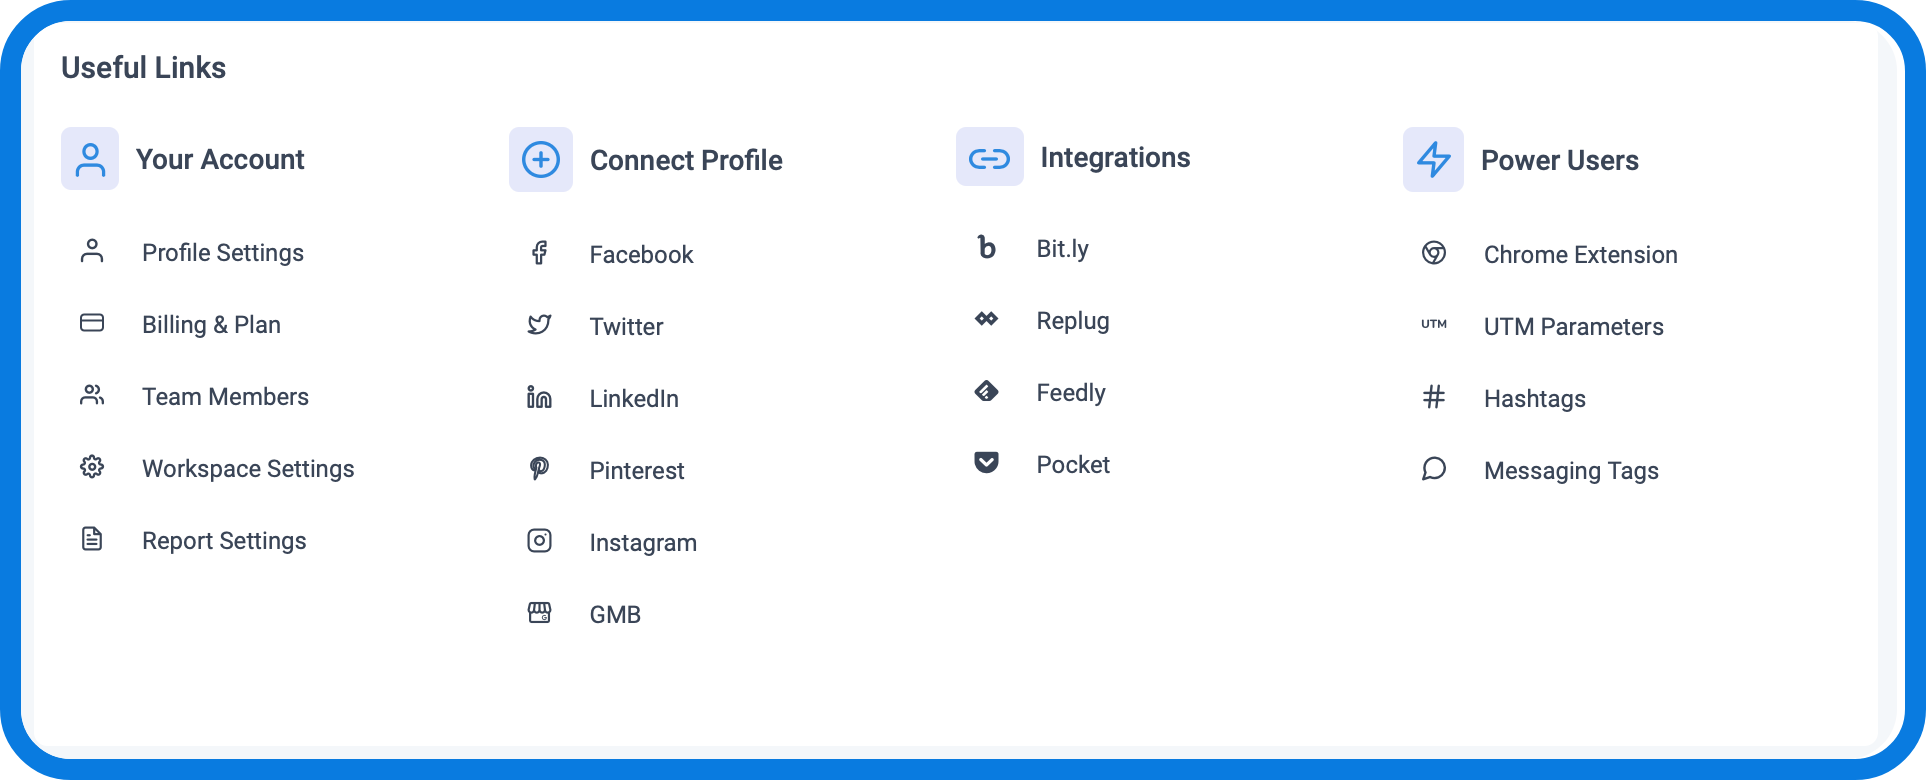
Lastly, we have included shortcuts to help you navigate through the website more effectively. We have made it easier to connect your social media accounts, integrate with third-party applications such as Replug, Feedly, and Pocket.
With this feature, we hope that you can:
- Increase your team’s focus, motivation, and productivity so you can do your best to achieve high-level goals!
- Identify constraints before they become problems
- Simplify your workflow
- Never miss deadlines!
Do you want a feature that’s not there?
Let us know, we are working on improving it to make the ultimate, all-in-one Dashboard!

Mariyum Noor
Mariyum Noor is a content marketer who is passionate about learning new things! She writes research-based blog posts for SaaS platforms that are seeking better ways to delight and engage their readers.