Instagram with its one billion monthly active users has now become the go-to platform for visual storytelling, product launches, influencer marketing, and much more.
But with the platform’s constant evolution and ever-changing Instagram algorithm, it can be challenging to keep up with the latest social media trends and insights.
That’s why we’ve put together this comprehensive guide on the top Instagram statistics for marketers in 2024. We’ll explore everything from engagement rates to demographic trends and provide you with the insights you need to create a winning Instagram strategy for your brand.
So sit back, relax, and get ready to up your Instagram game.
Also Read: Everything You Need to Know About Instagram Threads App
How fast is Instagram growing in 2024?
Number of Instagram users worldwide from 2020 to 2025
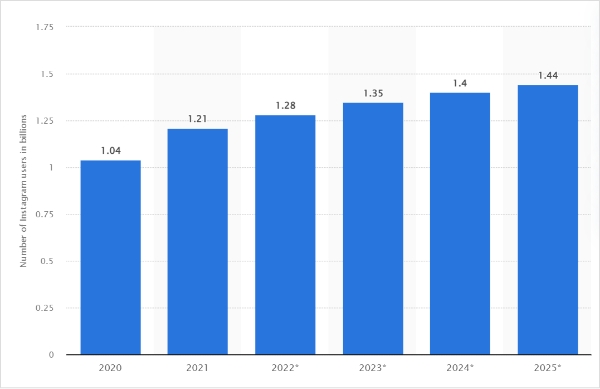
Instagram has been a trailblazer in the social media industry since its inception in 2010, and the numbers speak for themselves. As of 2023, Instagram has over 1 billion monthly active users, with over 500 million people using the platform every day.
These figures represent a staggering growth rate, with the platform adding over 100 million users in just the last year. Instagram’s rapid growth shows no signs of slowing down, with projections estimating that the platform will reach 1.35 billion users in 2023.
So, what’s driving Instagram’s explosive growth? One key factor is the platform’s ability to adapt and innovate, constantly introducing new features and updates to keep users engaged. From the introduction of Stories and Reels to the rollout of shopping and creator tools, Instagram has demonstrated a keen understanding of what its users want and need.
How businesses are using Instagram statistics?

Businesses are using Instagram statistics to gather insights into their audience’s behaviour, preferences, and engagement rates. They’re using this data to inform marketing strategies, optimize content creation, and even identify new revenue streams.
Here are some of the ways businesses are using Instagram statistics to understand their audience and optimize their content marketing strategies.
Instagram Marketing
Schedule your Instagram posts, Reels, and Stories, and get recommended best time to publish for maximum engagement.
Get Started for FREE
- Measuring engagement: Instagram statistics are providing businesses with insights into how well their content is resonating with their audience. By tracking engagement metrics such as likes, comments, shares, and saves, businesses are recognizing which types of posts are most effective in reaching and engaging their followers. For example, a fashion brand may notice that its followers engage more with posts featuring behind-the-scenes footage from a photoshoot than with product photos.

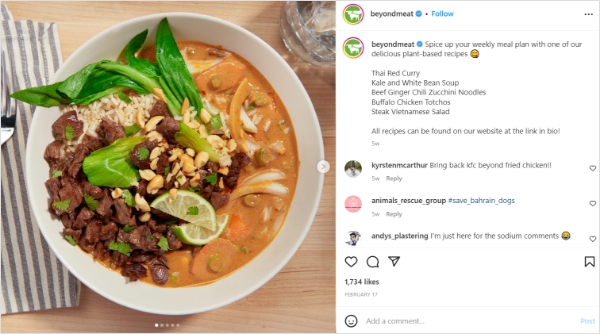
- Identifying trends: By analyzing Instagram statistics, businesses are identifying emerging trends and topics within their industry. For example, a health food company may notice that posts featuring plant-based recipes are receiving a higher engagement rate than other types of content, suggesting that there is a growing interest in this topic among their target audience.
- Monitoring competition: Instagram statistics are also coming in handy to track the social media activity of competitors. By monitoring metrics such as follower growth, engagement rate, and post frequency, businesses gain insights into how well their competitors are performing on Instagram. For example, a restaurant may notice that a competitor is posting more frequently and receiving higher engagement rates, prompting them to adjust their social media strategy to stay competitive.
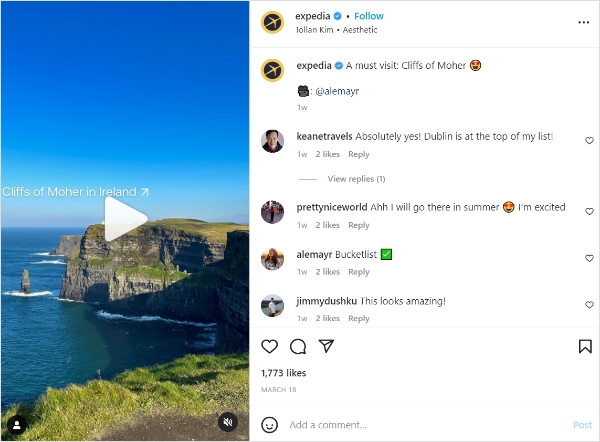
- Improving content strategy: Instagram statistics are also helping businesses gain insights into what type of content is most effective in engaging their target audience. For example, a travel company may notice that their followers engage more with posts featuring helpful tips than with posts featuring scenic landscapes, prompting them to adjust their content strategy accordingly.
A post featuring helpful tips with 15k likes
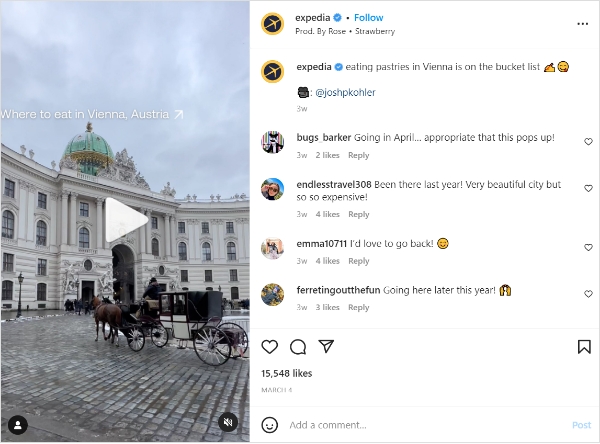
V.s
A post featuring scenic landscapes with 1700 likes
- Influencer partnerships: Instagram statistics are also being used to identify potential influencer partners for businesses. By analyzing the engagement rates and follower demographics of potential partners, businesses are identifying influencers who have a strong following within their target audience. For example, a fitness brand may partner with an influencer who has a large following of women interested in wellness, as this aligns with their brand values and target audience.
Top Instagram statistics you must know in 2024

These Instagram statistics provide a well-rounded view of the platform and you’ll find some valuable insights for planning your Instagram marketing strategy this year.
We’ve grouped together the statistics on Instagram into different categories for easy navigation.
Instagram users statistics
- Active users: Instagram has at least 1.318 billion active users worldwide.
- Users by age: 31.2% of Instagram users are in the age bracket of 25-34 years old.
- Users by gender: Males make up the majority of Instagram users at 51.8%, while females account for 48.2%. Check out latest gender demographics (The only gender options available for Meta reporting are male and female)
- Daily usage: Instagram users spend an average of 30 minutes per day on the app, with 500+ million users logging in daily.
- Countries with most Instagram users: India has the highest number of Instagram users at 229 million.
Instagram users by region
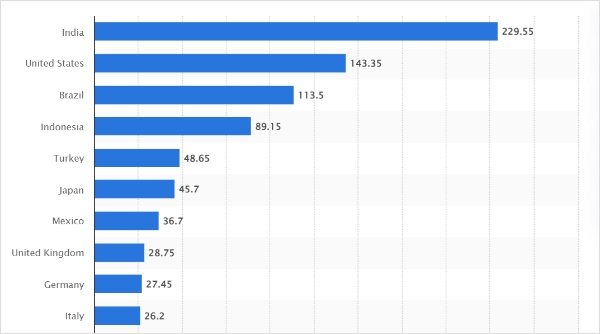
Top 5 countries with the most Instagram users:
- India: 229 million users
- United States: 143 million users
- Brazil: 113 million users
- Indonesia: 89.15 million users
- Turkey: 48.65 million users
Countries with the highest Instagram audience reach: Brunei has the highest Instagram audience reach with 74%. Kazakhstan came in second, with a penetration rate of 72.5% and Bahrain ranked third, with 72%.
Instagram-supported languages:
- Instagram supports 36 languages.
- In 2017, Instagram added right-to-left language support for Arabic, Farsi, and Hebrew.
Related Read: How to get more Instagram followers in 2024?
Instagram statistics for business
- Business follows on Instagram: Over 90% of Instagram users follow at least one business on the platform.
- Most popular Instagram category: The most popular Instagram category is food, with over 250 million posts tagged with #food per month.
- Engagement rate: Instagram has the highest engagement rate of all social media platforms, with 2-7% of users interacting with each post.
- ROI for marketers: According to HubSpot’s 2023 Social Media Trends Report, Instagram is the social media channel that provides marketers with the highest ROI.
- Business profiles on Instagram: Instagram has over 200 million business profiles on the platform.
- Visits to business profiles: Over 200 million Instagram users visit at least one business profile every day.
- User engagement with brands: 68% of Instagram users engage with brands regularly.
- Instagram app downloads: Instagram is the second most downloaded app in the world, with TikTok coming in the first place.
- Product discovery on Instagram: 60% of Instagram users discover new products on the platform.
- Interactions on Instagram videos vs. images: Instagram videos get 21.2% more interactions than images.
Instagram usage statistics by features

Instagram Stories statistics
- Daily active users: Instagram Stories has over 500 million daily active users.
- Viewership: Instagram Stories are viewed by 58% of Instagram users.
- Business usage: One-third of the most viewed Instagram Stories are from businesses.
- Location tags: Instagram Stories with location tags have a higher engagement rate than those without.
- Hashtags: Instagram Stories with hashtags have a higher engagement rate than those without.
- Business marketing: Over 60% of businesses use Instagram Stories for marketing.
- Interactive features: Instagram Stories with interactive features such as polls, quizzes, and question stickers have a higher engagement rate.
- Sound-on usage: 70% of Instagram users watch stories with the sound on.
- Engagement rates: Instagram posts have a higher engagement rate than Instagram stories because they appear on the feed indefinitely.
- Video vs. image content: Instagram Stories with video content have a higher engagement rate than those with only images.
- Link swiping: Over 25% of Instagram users swipe up on a link in Instagram Stories.
Instagram Reels statistics
- Availability: Instagram Reels is available in more than 50 countries worldwide.
- Discovery of products: Over 60% of Instagram users say they have discovered new products through Instagram Reels.
- Inspiration for content creation: Over 50% of Instagram users say they have been inspired to create content after watching Reels.
- Reasons for watching Instagram Reels:
- Over 40% of Instagram users say they watch Reels to pass time or be entertained.
- Over 30% of Instagram users say they watch Reels to learn new things.
- Over 25% of Instagram users say they watch Reels to get inspiration or content ideas.
- Over 20% of Instagram users say they watch Reels to stay up-to-date with the latest trends and news.
- Sound usage: Over 70% of Instagram Reels are watched with sound on.
- Popular categories: The most popular categories for Instagram Reels are comedy, dance, music, fashion, and beauty.
- Most viewed: The most viewed reel is by Khaby Lame with 286 million views.
- Length: Instagram Reels can be up to 90 seconds long.
- Reel Ads: Advertisements on Reels has a runtime of 60 seconds.
- Reel vs. videos: Reels get 22% more interaction on Instagram than standard video posts.
IGTV statistics
- IGTV launch: Instagram IGTV was launched in June 2018 as a standalone app for long-form vertical videos.
- Integration into Instagram: In February 2019, Instagram integrated IGTV into its main app, allowing users to watch IGTV videos without leaving the Instagram app.
- IGTV video length: IGTV videos can be up to 15 minutes long when uploaded from a mobile device and 60 minutes long when uploaded from the web.
- IGTV videos max file size: The maximum file size for IGTV videos is 3.6 GB for videos up to 60 minutes and 650 MB for videos up to 15 minutes.
- Sharing options: Instagram IGTV videos can be shared on Instagram Stories, the Explore tab, and the IGTV channel.
- Discoverability: IGTV content is discoverable via hashtags, location tags, and by following the IGTV channel of creators.
- Popular categories: The most popular categories for IGTV content are fashion, beauty, and lifestyle.
- IGTV monetization: Content creators can monetize Instagram by playing short ads along with their IGTV content.
- IGTV on explore page: IGTV videos are 4x larger than photos on the Explore page.
- IGTV captions: IGTV automatic captions are available in 16 languages.
Instagram Shopping statistics
- Availability: Instagram Shopping is available in over 70 countries.
- Checkout: Checkout is only avail
- able to customers in the US and a selected number of businesses.
- Users: About 130 million people use Instagram Shopping.
- Most successful categories: Fashion and beauty brands are most successful with Instagram Shopping, with a reported 33% of Instagram users saying they have purchased something from a fashion or beauty brand on the platform.
- Product tagging: Instagram shopping allows businesses to tag up to 5 products per image or 20 products per carousel post.
Instagram Live statistics
- Launch date: Instagram Live was launched in November 2016.
- Maximum video length: Instagram Live videos can be a maximum of 4 hours in length.
- Daily viewership: Instagram Live videos are watched by over 100 million users per day.
- Average time spent: The average time spent watching Instagram Live videos is around 26 minutes.
- Common content type: The most common type of content on Instagram Live is personal vlogs and Q&A sessions.
- Live rooms: Instagram Live has a feature called “Live Rooms” that allows up to four people to go live together.
- Live badges: Instagram Live has a feature called “Live Badges” that allows viewers to purchase badges and support their favourite creators during live streams.
- Highest views: Acun Ilicali holds the record for the highest number of views (3M+) in an Instagram Live stream.
Instagram statistics by content

Photo posts
- Images with a single dominant colour generate 17% more likes than those with multiple colours.
- Photos with faces get 38% more likes than those without.
- Bright and warm colours tend to perform better than cool and muted colours.
- The most popular filter on Instagram is Clarendon, followed by Gingham and Juno.
Video posts
- Videos with a length of 30 seconds or less perform best on Instagram.
- Square videos are the most popular format on Instagram, followed by landscape and vertical videos.
- Videos with a clear message or story tend to perform better than those without a clear message.
Carousel posts
- Carousel posts receive 3x more engagement than regular posts on Instagram.
- Carousel posts can include up to 10 photos or videos in a single post.
- Carousel posts with a consistent theme tend to perform better than those with unrelated content.
- 60% of brands use carousel posts on Instagram.
Instagram influencers statistics

- Most popular influencer marketing platform: Instagram is the most popular influencer marketing platform in 2024.
- Number of influencers: There are estimated to be over 500,000 active influencers on Instagram.
- Type of influencers: 54% of all influencers on Instagram are nano-influencers, while 33% are micro-influencers.
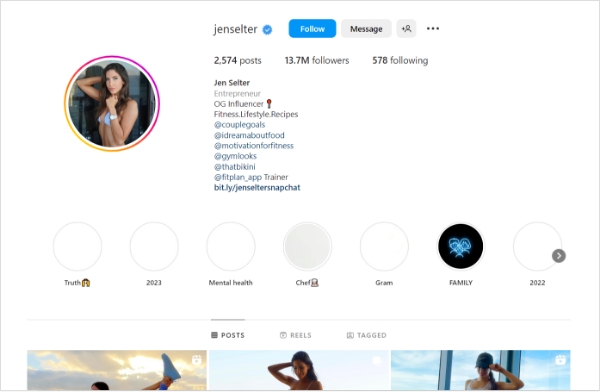
- Average follower count: The average number of followers for an Instagram influencer is 50,000, but this number varies depending on the niche, engagement rate, and level of influence.
- Top niches: Fashion and beauty are the most popular niches for Instagram influencers, followed by food and travel.
- Engagement rate: The average engagement rate for Instagram influencers is around 2-3%.
- Most followed influencer: Christiano Ronaldo is the most followed Instagram influencer with 547 million followers.
- Most expensive influencer: The most expensive Instagram influencer is Cristiano Ronaldo who charges $2,397,000 per post.
- Influencer impact: 61% of consumers trust influencer recommendations more than brand content.
- Most used feature: Instagram posts (78%) and Stories (73%) are popular features for influencers to share sponsored content with their followers.
Instagram ads statistics

- Business usage: Over 2 million businesses use Instagram for advertising.
- Reach: Instagram ads have a potential reach of up to 849.3 million users.
- Cost-per-click: The average cost per click (CPC) for Instagram ads is $0.70-$1.00
- Cost-per-impression: The average cost per impression (CPM) for Instagram ads is $5.00.
- Video vs image ad: Video ads on Instagram have a 3x higher engagement rate than image ads.
- Feed vs stories ad: Stories ads have a 9% higher completion rate than regular feed ads.
- Ad revenue: Instagram’s ad revenues are expected to hit $39.7 billion in 2023.
- Popular categories: Instagram ads are most effective for businesses in the fashion, beauty, and travel industries.
- Ad audience: The highest Instagram advertising audience is within the 25-34 age group.
- Product discovery: 83% of Instagram users discovered new products or services through the platform.
Instagram demographics statistics
There exists a number of Instagram demographics statistics, lets go throught them one by one.
Instagram age demographics
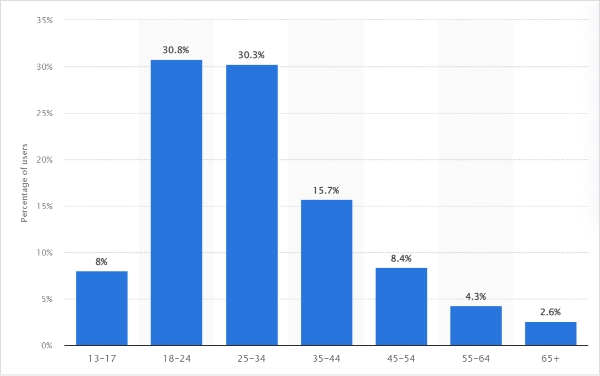
Age distribution of Instagram users:
Here are the statistics for age distribution of Instagram users:
- 18-24 years old: 30.8%
- 25-34 years old: 30.3%
- 35-44 years old: 15.7%
- 45-54 years old: 8.4%
- 55-64 years old: 4.3%
- 65+ years old: 2.6%
Instagram gender demographics
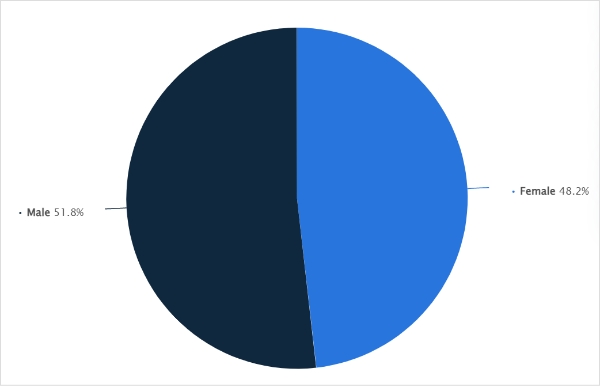
Gender distribution of Instagram users:
- Male: 51.8%
- Female: 48.2%
Instagram engagement statistics

- Daily usage: Instagram users spend an average of 30 minutes per day on the app.
- Engagement rate: The average engagement rate for all types of Instagram posts by business accounts is 0.65%.
- Video post engagement: The average Instagram engagement rate for video posts is 0.66%.
- Photo post engagement: The average engagement rate for photo posts is 0.59%.
- Highest engagement by post type: Of the three types of Instagram posts, carousels have the highest engagement rates.
- Reel vs. video: Reels get 22% more interaction on Instagram than standard video posts.
- Likes: A total of 4.2 billion likes occur on Instagram each day.
- Faces in photos: Photos having faces perform almost 40% better than those without faces.
- Most engagement days: Instagram users show the most engagement on Wednesday and Thursday.
- Location tags: Posts with location tags get 79% more engagement than those without tags.
Befriend these insights and create a winning Instagram strategy in 2024
Phew! You’ve finally made it to the end of this super-long list of Instagram statistics.
The statistics we’ve covered in this blog demonstrate the immense potential that Instagram holds for businesses of all sizes. From the power of influencer marketing to the importance of using video content, these insights can help you as a marketer stay ahead of the curve and create effective Instagram strategies.
However, it’s important to remember that numbers can only take us so far. To truly succeed on Instagram, you must also focus on creating compelling, engaging content that resonates with your audience. By combining these insights with a creative approach, you can unlock the full potential of Instagram and drive real results for your business. Happy ‘gramming!
Also Read: Everything You Need to Know About Instagram Threads App

Hareem
Hareem is a freelance writer for B2B and B2C SaaS platforms. She has a knack for turning technical jargon into engaging stories and has helped many companies convey their brand message with clarity and impact.