We constantly aspire to bring you new and improved features to enhance your experience with ContentStudio. In our latest endeavor, we have tried to enlight you how well your content and social media strategy is working by associating statistics with everything you post and share. Marketing without analytics is like shooting arrows in the dark hoping to hit the target. The chances are slim to none, that is why we have brought you social media analytics.
Whether you are a marketer or a business owner, you need to keep track of your money and efforts being spent on social media. Measuring the ROI from social media could prove to be a challenge especially with the stack of insights and metrics provided by the networks. It is important to grill down the stats and present the data in a meaningful way for decision-makers to take appropriate steps.
With the introduction of the Analytics section in ContentStudio, you will be able to gauge and measure the pace, effects, and results of your social media marketing campaigns. Each section is beautifully crafted so you can extract accurate information about what is happening on your social channels.
The analytics section in ContentStudio is segregated w.r.t individual social media channels for better debunking the performance of each channel. Let us dig deep into each section and see what each section has to offer.
Social Analytics Overview
For modern-day marketers, it is essential to determine the performance of social media marketing across all social channels. This gives a wholesome understanding of your social engagement against attributes such as posts, shares, likes, comments. The social analytics overview tab shows the combined statistics of all your social media channels.
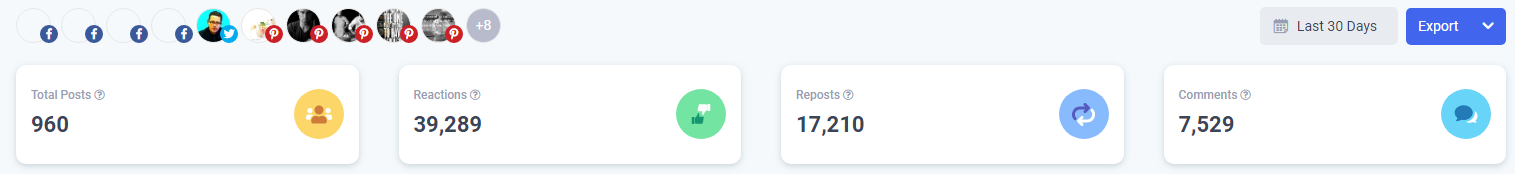
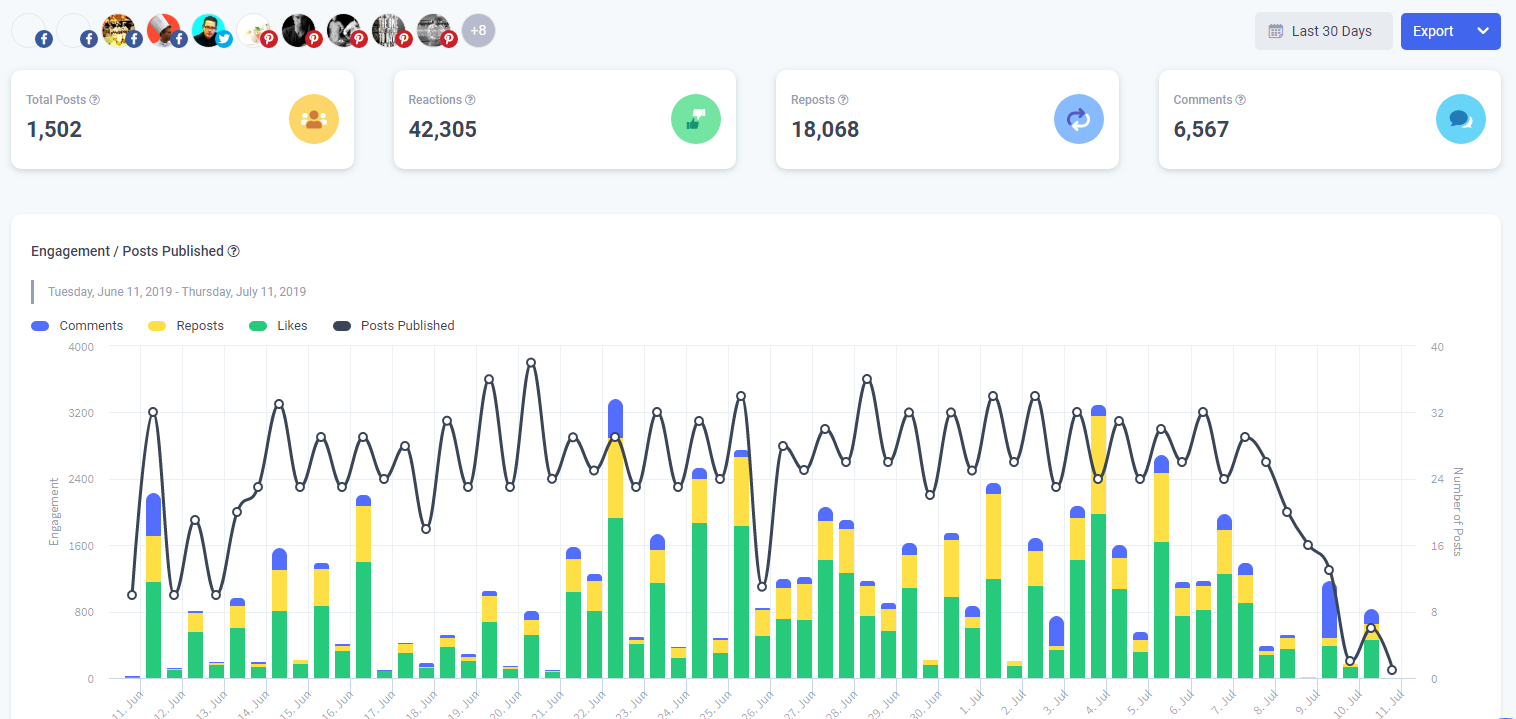
The combined engagement statistics are beautifully displayed in a colorful graph. The graph is explained below.
Comments: Comments are the written expression of thoughts that you have regarding people, posts, articles, pictures or tweets. In the analytics section, this number shows the combined textual interchange on your posts for a specific period of time.
Reposts: Reposts are shown in yellow color and are the total number of times your shared Content has been reshared or reposted by others.
Likes: The total number of likes in green color is an indicator of how many people relate to the content you are sharing. This content might be in any form.
Posts Published: This is the aggregated pieces of content which you have shared with your audience. This figure is shown in black color and encompasses all other graphs.
On the X-axis of this graph is the timeline which can be custom selected to fit any range. The Y-axis shows the engagement.
Engagement Rollup
This includes total engagement, average engagement, and posts sent. This allows you to evaluate the overall performance of your social media channels over time.
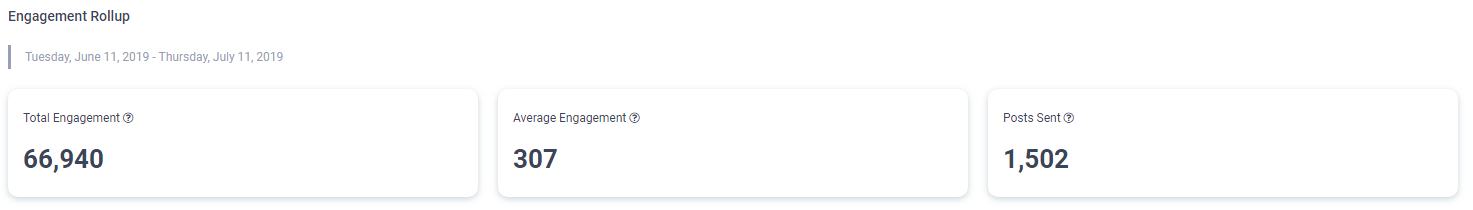
Total Engagements
The total number of times a user interacted with a Tweet. This includes clicking on the Tweet itself, Retweets, replies, follows, likes, links, cards, hashtags, embedded media, username, profile photo, or Tweet expansion.
Average Engagement
This number represents all the posts published on social media divided by their engagement (likes, comments, etc combined). It shows an average of how your overall content is performing. Those performed well plus those which did not.
Top Posts
It’s good to know the nature of the content which best resonates with your audience. This way you can share the type of content which they find interesting and expect more engagement from them. This is what the top post section is all about.
It shows your best content from all social channels. Not only that, but you can also see the best performing content from each of the 4 individual social channels namely Facebook, Twitter, Linkedin, and Pinterest.
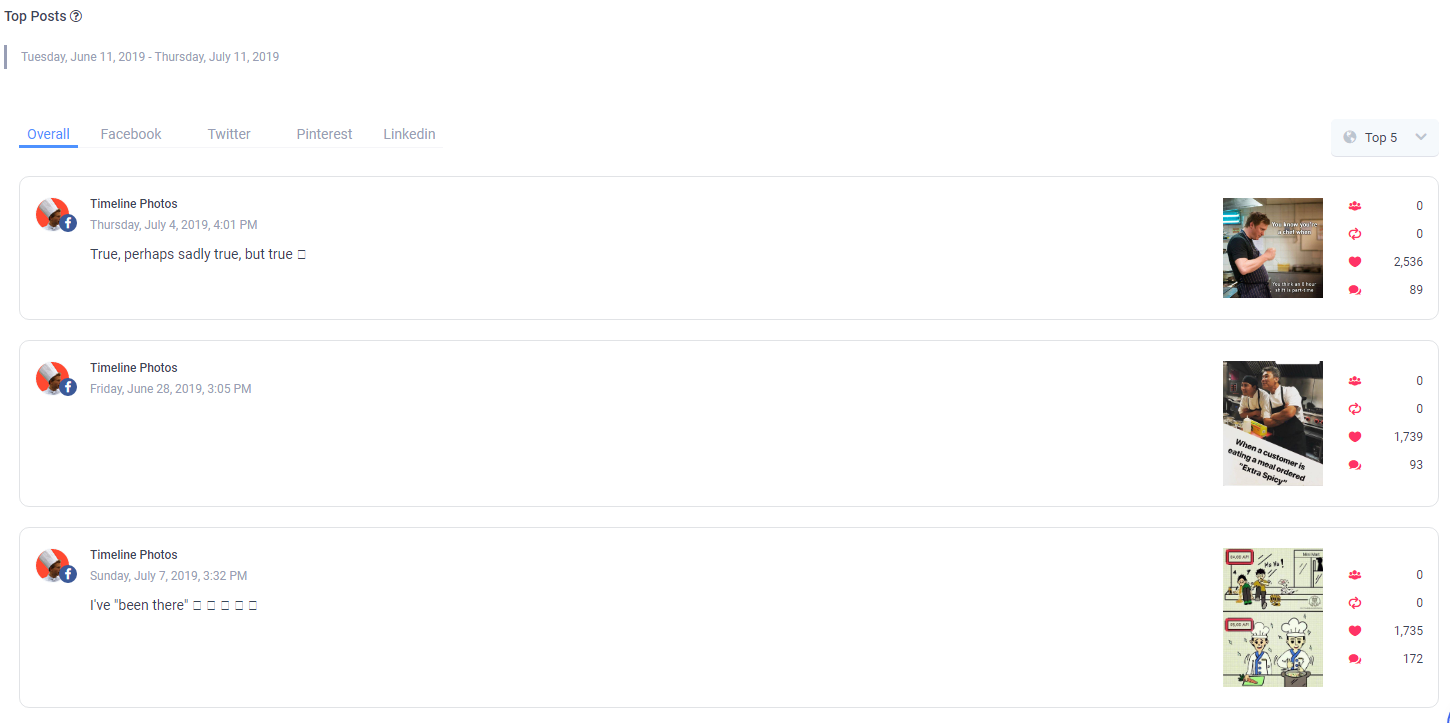
The posts are evaluated based on impressions, clicks, Total engagement, and comments. The post with a better-aggregated score in all four categories is declared as the top post.
Each social channel has its own specific measure of post engagement e.g. likes, comments, retweets, and repins. You can switch between the social channels and check the tops posts of each one.
Account Performance
Many people using ContentStudio are social media managers handling dozens of accounts at once. This section shows the individual performance of each account irrespective of the social channel. The account with the most engagement is shown at the top.
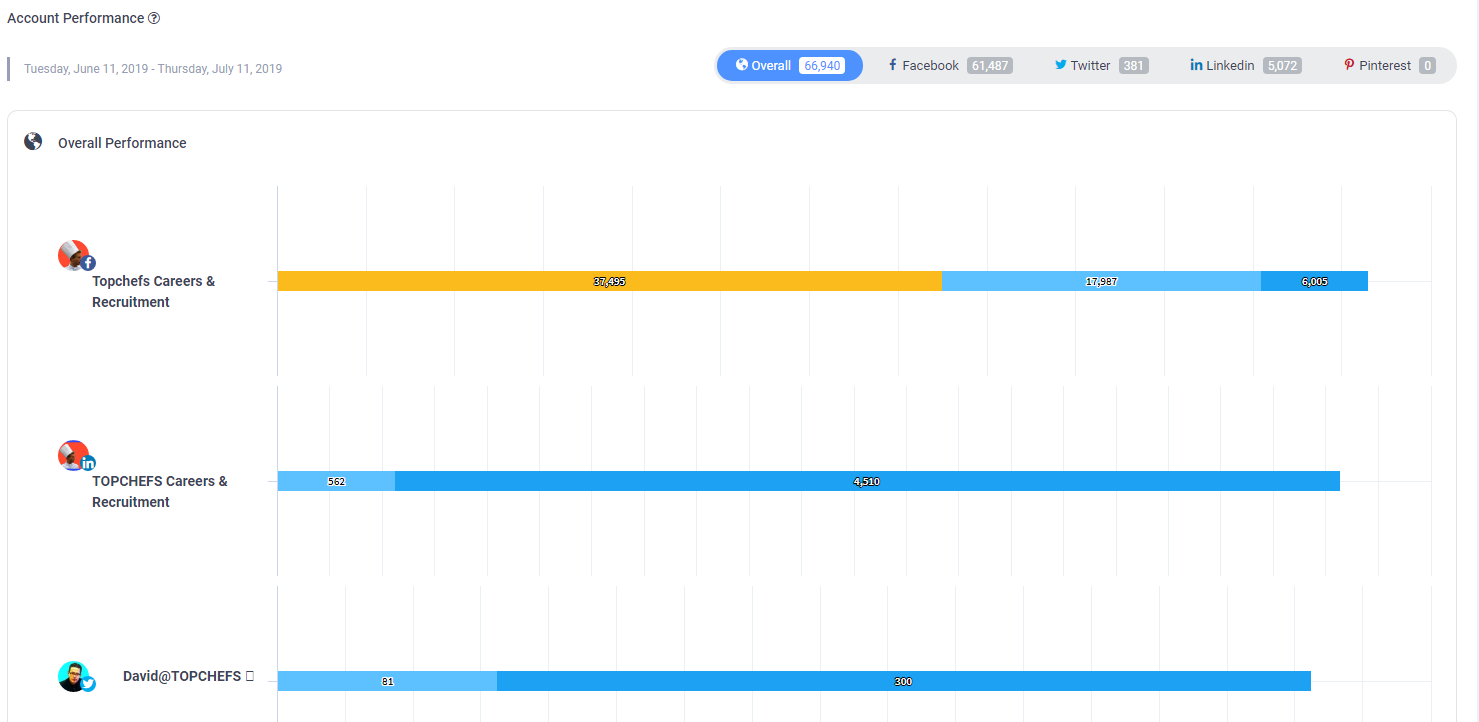
The top bar in this section shows the overall engagement of all the accounts social channels combined. The channels are arranged in descending order of engagement with the bar specifying engagement attributes such as comments, likes, and tweets, etc.
Overall Social Channel Engagement
This section shows you the channel wise combined engagement of all the connected accounts. For example, you can see how much engagement all of your Facebook accounts have generated, similarly for Linkedin, Twitter, and Pinterest.
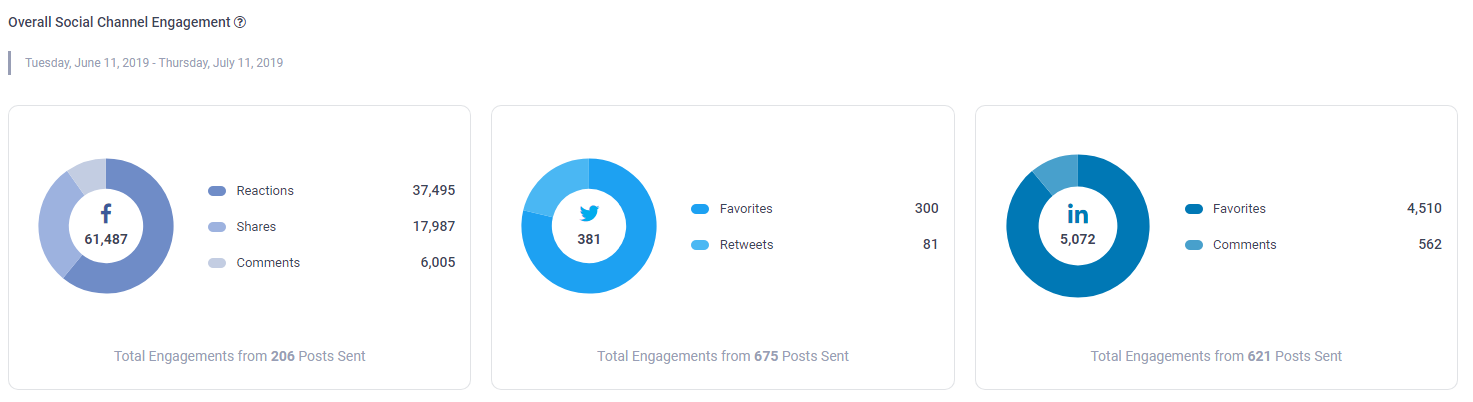
The pie charts show the overall performance of individual social channels including all the pages and groups associated with your account. Now, what you can do is, dig in detail statistics of each social media channel by selecting them from the left bar menu. These charts will help you identify, set, and measure performance goals. By stacking the stats against the graphs generated for a previously set period, you can see a rise or fall in the engagement numbers.
Reporting
Reporting is the quantifiable way of showing the performance of your campaigns. It is the trademark sign of a top SaaS application software. With ContentStudio, you can now instantly create detailed reports for Facebook, Twitter, LinkedIn, and Pinterest accounts. Determine the ROI of your social media engagement and content strategy.
This is not only helpful in disseminating statistics to others but can also be used for record-keeping. The reporting panel gives you ready-to-send social media reports.
The reports can be generated by clicking on the export button in the top right corner.
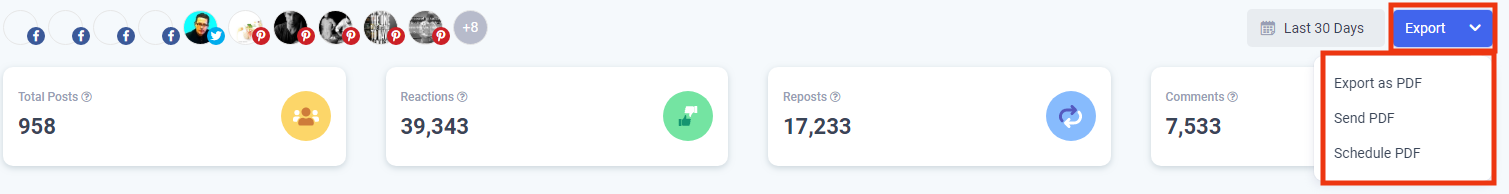
Clicking on the blue export button, you will see a drop-down menu. Let’s explore the options of this menu.
Export as PDF
This option directly downloads a branded report in the download folder of your PC. The report will contain analytics statistics of the particular section for which you have generated the report whether it be Overview, Facebook, etc.
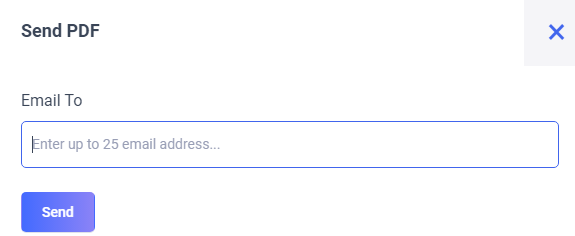
Send PDF
The send PDF allows you to send the branded report to 25 different people by entering their emails. You can separate email addresses by using commas between them.
Schedule PDF
The great thing about the reporting section is that you can automate the whole process. Keep clients updated with regular and Automated reports.
Share comprehensive reports with your clients. Automate this process by scheduling reports in advance which land directly in your client’s inbox. Create unlimited reports with time limits ranging from weeks to months.
This option will automate the report generation and distribution for you. Now you can pre-set the date and recipients who will receive the reports.
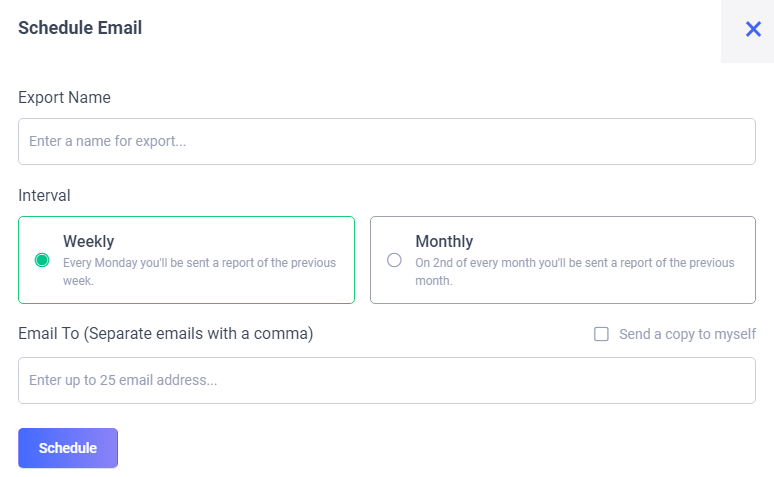
Set an appropriate name for the reports campaign. Here you have two options. Either you can send weekly reports sent out every Monday, or Monthly reports sent out on the 2nd of each month.
Remember that the scheduled report will be compiled for the last period e.g. choosing weekly will compile the report from the data of the previous week. Similarly, choosing “monthly” will compile reports of the previous month.
Customization
ContentStudio empowers you to instantly share channel performance with clients in the form of branded reports. You can customize the reports with their logo or brand color to give a personalized touch while reporting.
We gather your social data and arrange it an eye-catching format. The date range against which the data is included in the report is customizable to suit your need. This will help you convert your social activity into business decisions.
This is all from the analytics overview section. Let’s dig in detail what each social media analytics section has in store for us.

Wasiq Naeem
Wasiq Naeem is a content and digital marketing veteran who is passionate about his writing. Extensive research and producing high-quality content is just another day at the office for him.