Contentsudio presents another magnificent LinkedIn Analytic Module, which ensures the customers to save their time by analyzing, interpret the post level of performance, and track the pages with the public engagement. They are allowed to examine the LinkedIn company pages’ insights to measure the social presence of the brand or company in front of a different audience.

Total followers: The total number of users who followed you on the LinkedIn account.
Impression: It exposes the number of audiences who have viewed your LinkedIn posts on their screen.
Engagement: It shows the social engagement of the audience towards your LinkedIn post.
Favorites: The total no. of likes that are received on your page.
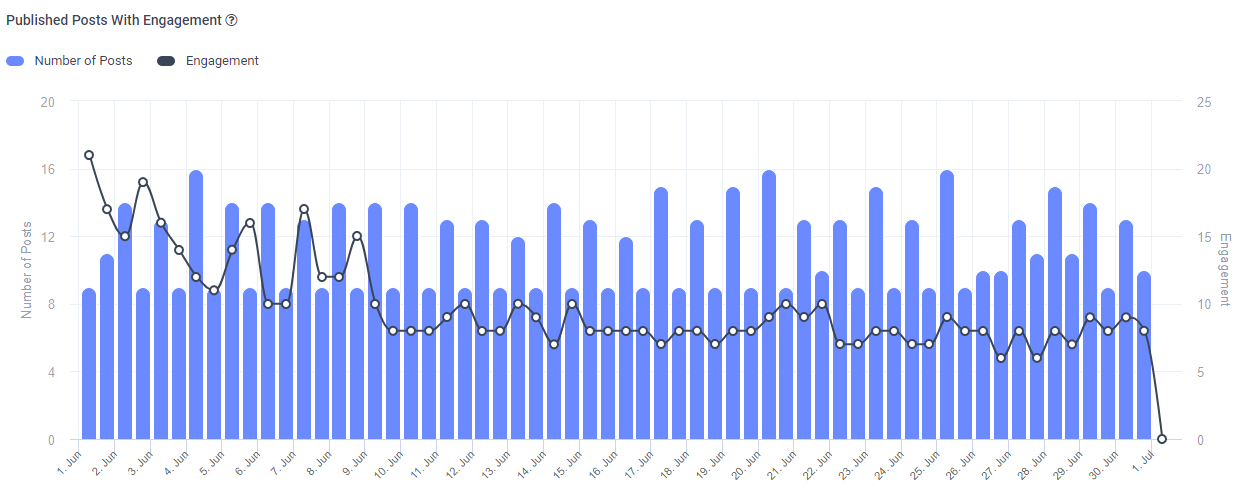
Published Posts With Engagement
The powerful Linkedin reporting allows you to examine the audience interaction to the LinkedIn page post over time. With the help of the stats, you would easily gain valuable insights by classifying the average engagement to each LinkedIn post in the past 30 days or you can select the interval to change the time duration.
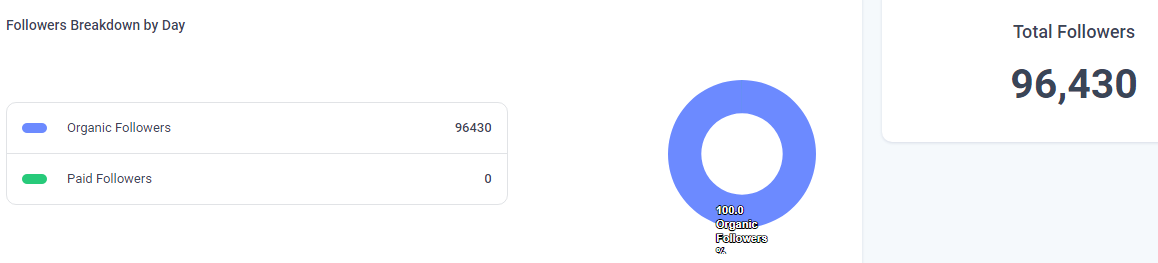
Audience growth
Linkedin statistics gives direction to analyze the impact of ads on your LinkedIn company page growth by comparing organic and paid followers.
It helps you to understand the targeted audience you need to reach and drives more conversion and traffic toward your website or LinkedIn page.
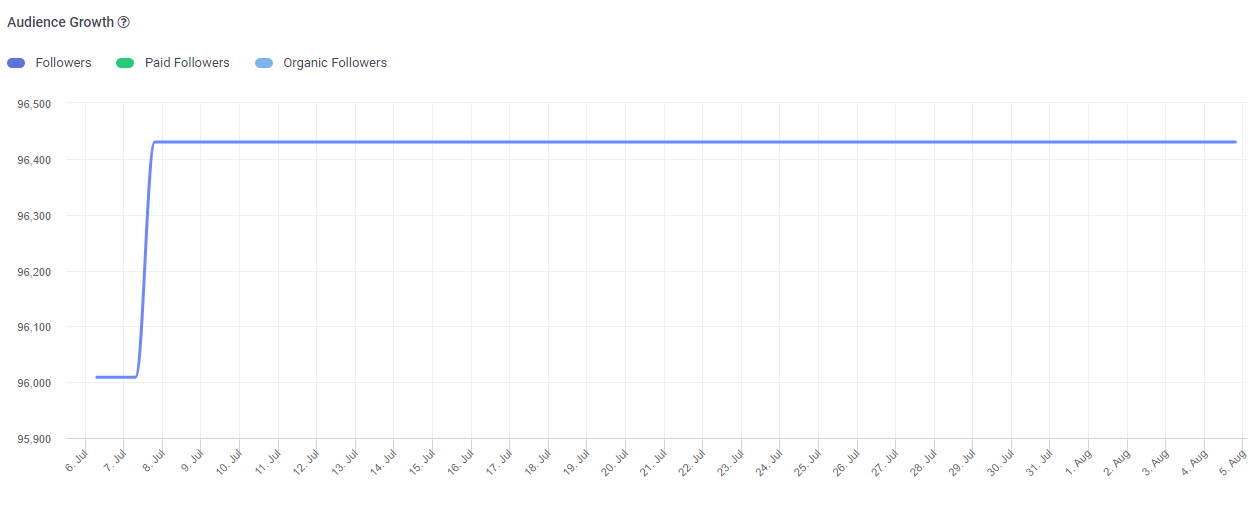
These valuable insights are presented in the form of a comprehensible pie chart as shown in the image.
Engagement Rate
Now, you can monitor the performance of your published posts such as comments and likes which your posts have received on different days of the week.
You can identify the best performing posts and view the social engagement, reaction and comments gained in the last few weeks all across the several pages.


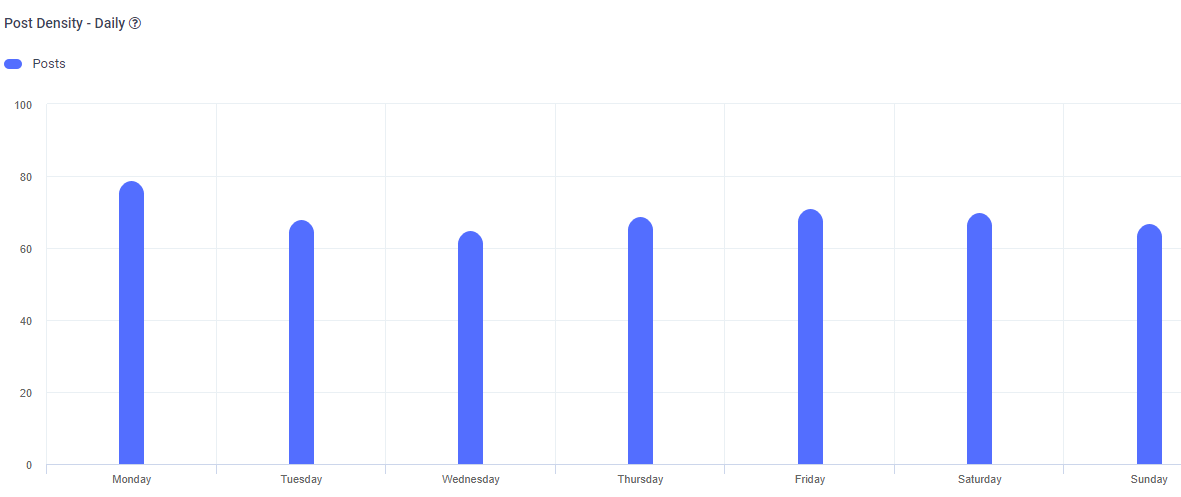
Post Density
Want to see the total number of published posts during the days of the week, we have got you covered. You can view the total no. of posts each day.
Related Read: How We Gained 20K+ Organic Followers on LinkedIn via Content Marketing (A Case Study)
Engagement by day/time
In these statistics, you can readily identify the timing and days of the posts to see which image, link, or post generates the most social engagement towards the page. It helps the customer to figure out the best day and popular times to post to drive more social engagement.

Top Posts by Engagement
You can identify the best performing posts and view the social engagement, reaction and comments gained in the last few weeks via all pages.


Sadia
Sadia Umer works on putting together high-quality content for ContentStudio customers to read. When she isn't writing, she can be found reading and trying random life experiments.